


Bitcoin is once again close to writing a new history. On the weekly chart of the largest cryptocurrency, a golden cross is approaching – an event that has never happened before. If the long-term moving averages complete a bullish cross, it will be another confirmation of the beginning of a new bull market for cryptocurrencies.
Back in February of this year, the first-ever death cross appeared on Bitcoin’s weekly chart. The event was unprecedented, as no bear market had ever led to such a situation before. However, a reverse intersection is approaching – a golden cross that could spark a long-term uptrend.
The First Golden Cross in Bitcoin History
The golden cross is a basic signal of technical analysis. The classic golden cross and death cross are determined on different time frames by the interaction of two long-term 50-period and 200-period moving averages.
Naturally, in the case of the weekly chart, the 50-week moving average (50W MA, orange) and the 200-week moving average (200W MA, blue) are taken into account. It is worth adding that the higher the interval, the more significant the signal is for the long-term price action of the asset.
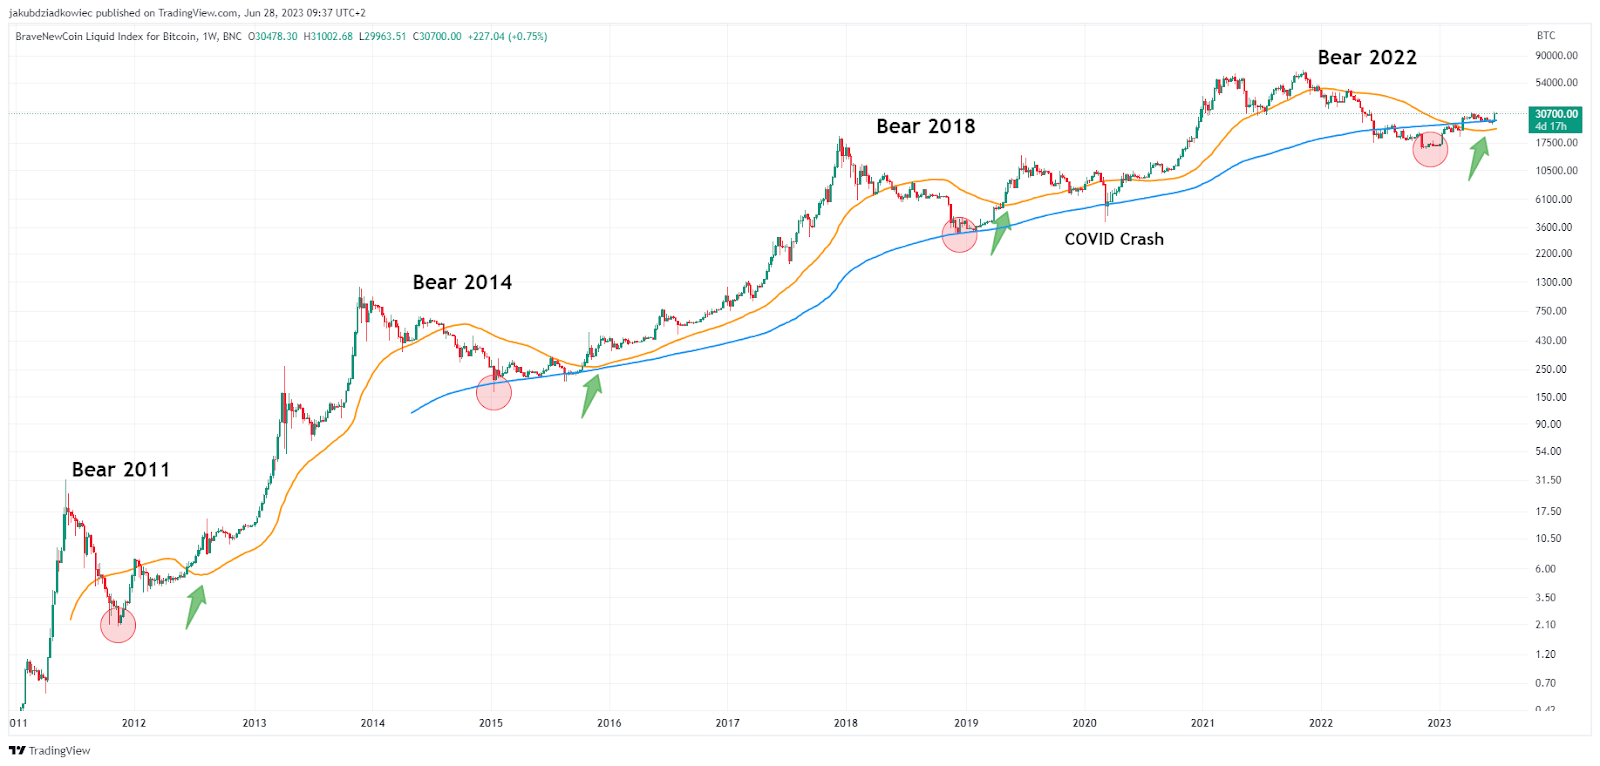
From the beginning of BTC trading, it has been a strongly rising asset its 50W MA never fell below the 200W MA. The first death cross in BTC history only appeared at the beginning of this year (red circle).
The reason for it was that BTC price action weakened strongly throughout 2022 and fell 77% against the November 2021 ATH.
Interestingly, in the previous bear markets of 2014 and 2018, the drop in Bitcoin price from the historical ATHs was deeper – 86% and 84%, respectively.
However, a death cross did not follow those periods because the earlier bull markets generated much larger increases. This caused a much greater distance between the 50W MA and the 200W MA, so the former “didn’t manage” to fall below the latter.
Is the Worst Over?
Looking at the above chart from a slightly different perspective, there is an additional argument for starting a new bull market for cryptocurrencies. It comes from the movement of the 50W MA itself in relation to the historical BTC price action.
So far, four moments can be identified where the 50W MA reversed its direction after long-term declines and began to rise (green arrows). These occurred in July 2012, November 2015, and May 2019. The fourth bullish bounce of this moving average occurred last month.
We notice a certain regularity if we now juxtapose these events with BTC trading history. Namely, whenever the 50W MA initiated a bounce, the bear market was already over, and Bitcoin had already reached a macro bottom (red circles).
If this rule also holds for the current cycle, the November 2022 FTX crash and the BTC price at $15,600 would mark the end of long-term declines. Therefore, the 50W MA bounce is another argument for starting a new bull market for the entire cryptocurrency sector.
When Will the Golden Cross for BTC Occur?
If a long-term bull market has indeed begun, then a golden cross on Bitcoin weekly chart is only a matter of time. Current data allows us to make some guesses about when this bullish event might occur.
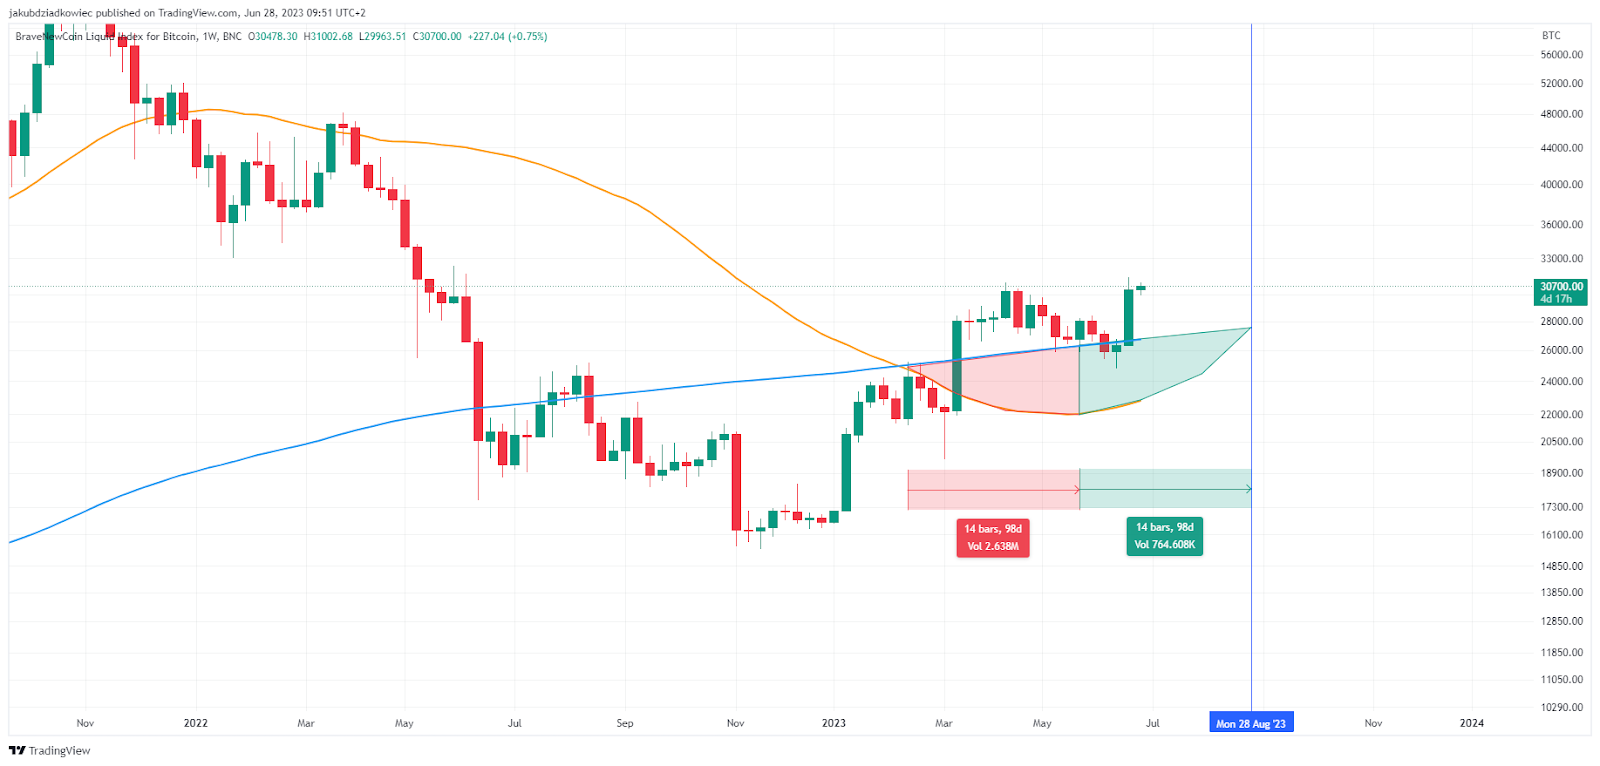
The first-ever weekly death cross occurred on February 13, 2023. The descending 50W MA bearishly crossed the 200W MA. However, as a result of the rise in the BTC price since the beginning of this year, just 14 weeks later, the 50W MA bounced back. On May 22, it resumed its upward trajectory.
If we assume that the golden cross will follow the same 14-week period, we can expect this event on August 28. Of course, the slope of the 50W MA and the pace of its eventual return above the 200W MA will also depend on the future price action of BTC.
However, suppose the behavior of the 50W MA exhibits historical similarity to the previous 3 cycles. In that case, the end of the summer will see the first golden cross in Bitcoin trading history on a weekly chart.
For BeInCrypto’s latest crypto market analysis, click here.
Disclaimer
In line with the Trust Project guidelines, this price analysis article is for informational purposes only and should not be considered financial or investment advice. BeInCrypto is committed to accurate, unbiased reporting, but market conditions are subject to change without notice. Always conduct your own research and consult with a professional before making any financial decisions.
Be the first to comment