The Ripple XRP price has moved above the $0.550 horizontal resistance area, reaching a high of $0.586 on October 24.
During the increase, XRP moved above the $0.550 horizontal resistance area but has yet to reach a close above it. Will it finally do so?
XRP Moves Above Critical Long-Term Level
The weekly technical analysis of XRP reveals that the price has followed an upward trend since the beginning of the year, with a well-established ascending support trendline.
This trendline has been tested and confirmed multiple times, most recently in the first week of October (green icon).
Read More: Best Crypto Sign-Up Bonuses in 2023.
Following this bounce, the price created a bullish engulfing candlestick pattern. This pattern occurs when the entire price decline from the previous period is reversed in the next period.
After this candlestick pattern, XRP’s price jumped to $0.586. Although this indicates a successful reclamation of the $0.550 price level, a weekly closing above this level has not been achieved yet.
The weekly Relative Strength Index (RSI), which is a momentum indicator, is currently in a state of uncertainty.
Traders use the RSI to gauge whether a market is overbought or oversold, helping them decide about buying or selling an asset.
When the RSI reading is above 50 and the trend is upward, it favors the bulls, indicating strength in the market. Conversely, if the reading falls below 50, it suggests a disadvantage for the bulls.
Currently, the RSI is on the rise but is hovering right around the 50 level (green circle), failing to provide a clear confirmation of the trend’s direction.
Click here for Ripple-XRP price predictions.
What Do the Analysts Think?
Cryptocurrency analysts on X have a bullish outlook on the future XRP movement.
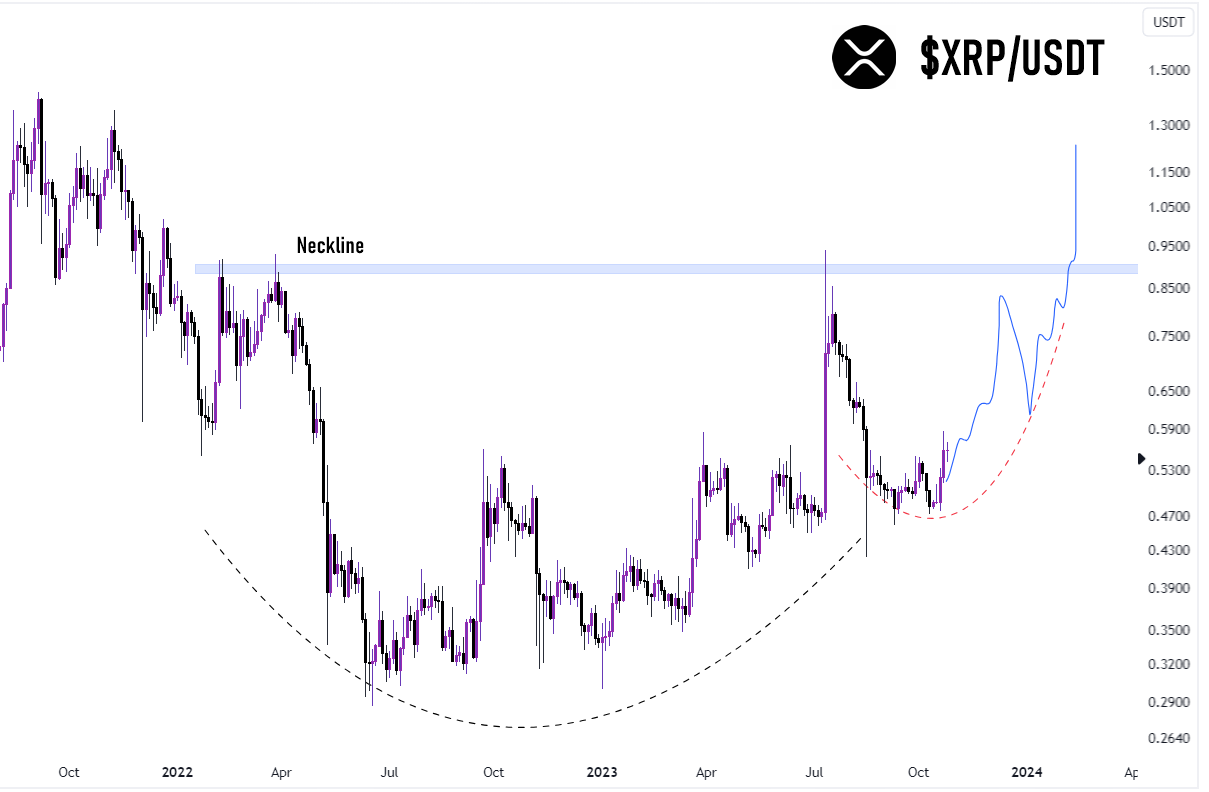
The most bullish prediction comes from Thescalpingpro, who has outlined a long-term cup and handle pattern with a neckline at $0.90.
A breakout from this pattern would take the XRP price well above the $1 threshold.

LordCrypto and Predycto believe that the minor $0.50 horizontal area has now become support, and the price will bounce above it and resume increasing.
However, it is worth mentioning that a whale transferred more than $11 million worth of XRP to the Bitso exchange.
XRP Price Prediction: Will Breakout Be Confirmed?
The daily timeframe chart gives a bullish reading, supporting the possibility that a weekly close above $0.550 will transpire.
Firstly, the price has broken out from a descending resistance trendline, often a sign that the preceding decrease has ended.
Secondly, it reclaimed the minor resistance at $0.530, something it had struggled to do since August.
Finally, the daily RSI is increasing and above 50, both signs of a bullish trend.
If the upward movement continues, the XRP price can increase by another 30% and reach the 0.5-0.618 Fib retracement resistance level at $0.680-$0.740.

Despite this bullish XRP price prediction, a daily close below the minor support at $0.530 will invalidate the breakout. A 20% drop to the closest support at $0.430 could occur.
Read More: Everything You Need To Know About Ripple vs. SEC
For BeInCrypto’s latest crypto market analysis, click here.
Disclaimer
In line with the Trust Project guidelines, this price analysis article is for informational purposes only and should not be considered financial or investment advice. BeInCrypto is committed to accurate, unbiased reporting, but market conditions are subject to change without notice. Always conduct your own research and consult with a professional before making any financial decisions.


Be the first to comment