


Bitcoin Price Prediction – January 10
The Bitcoin price prediction shows that BTC may continue to face serious selling pressure, with the daily low found within the $39,650 level.
BTC/USD Long-term Trend: Bearish (Daily Chart)
Key levels:
Resistance Levels: $45,000, $47,000, $49,000

Support Levels: $36,000, $34,000, $32,000
BTC/USD continue to face the downtrend as the selling pressure keeps bringing the first digital asset towards the lower boundary of the channel. Meanwhile, traders are not surprised with the selling pressure as bulls failed to push the coin to the upside. However, until bulls break above 9-day moving average, the king coin may likely face a prolonged bearish movement.
Bitcoin Price Prediction: Bitcoin (BTC) May Fall to $38,000 Support
At the time of writing, the Bitcoin price is trading down just under 2.04% at its current price of $41,021. This marks a serious fall from its daily high of $42,250 sets close to the lower boundary of the channel. However, the coming few days may continue to bring the price of Bitcoin to the negative side, as it is currently trading moving averages.
BTC/USD is likely to cross below $40,000, with bears moving the market price towards the south but any bearish movement below the lower boundary of the channel may take the price to the support levels of $36,000, $34,000, and $32,000 while the resistance levels could be located at $45,000, $47,000, and $49,000 but the technical indicator Relative Strength Index (14) moves into the oversold region.

BTC/USD Medium – Term Trend: Bearish (4H Chart)
Looking at the 4-hour chart, the Bitcoin price is now struggling in a consolidation mode, and this could make the cryptocurrency move sideways or bullishly over the next few hours. Meanwhile, as the coin remains below the 9-day and 21-day moving averages, cross below the lower boundary of the channel could hit the support at $40,000 and below.
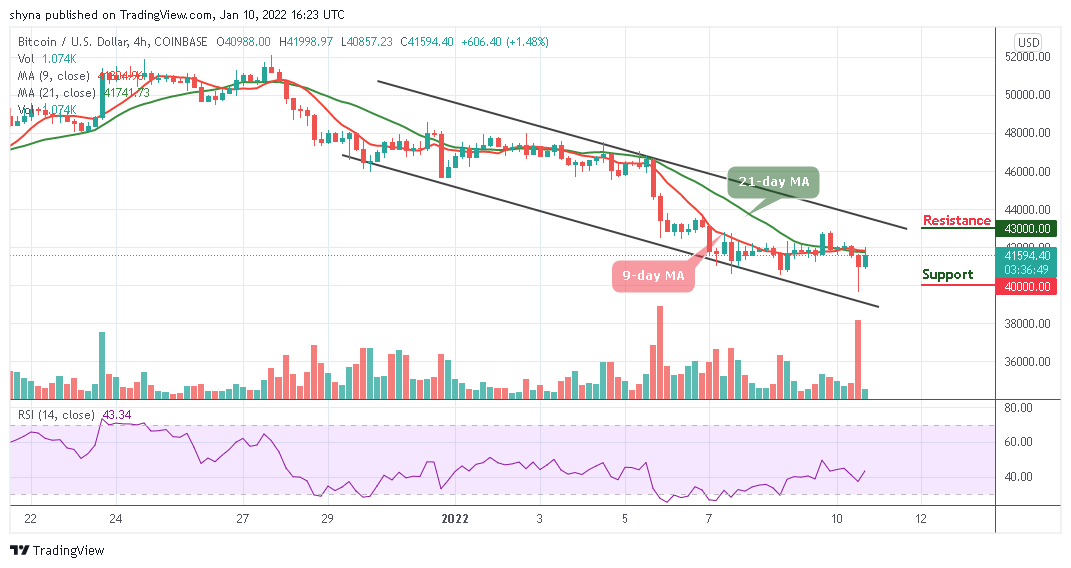
On the contrary, the coin is still roaming around $41,594 as bulls are pushing the price towards the 9-day and 21-day moving averages. Meanwhile, the $43,000 and above may come into play if the technical indicator Relative Strength Index (14) stays above 40-level.
Looking to buy or trade Bitcoin (BTC) now? Invest at eToro!
68% of retail investor accounts lose money when trading CFDs with this provider
Read more:
Be the first to comment