


Bitcoin is currently displaying a symmetrical triangle pattern on lower time frames. What this indicates is a potential for a significant price move. At present, Bitcoin is trading at $58,981.14. But, recent data shows mixed signals for its short-term trajectory.
Recent Bitcoin Price Trends
Over the past seven days, Bitcoin has risen by 6.4%, including a modest 0.6% increase in the last 24 hours and a 0.2% rise in the past hour. However, these gains follow a sharp decline earlier in August 2024.
Bitcoin Chart Analysis: Volatile Start in August
Bitcoin began August at $65,276 but quickly experienced a steep drop, falling to $53,984 between August 2nd and 5th. This decline was followed by a brief surge on August 8th, when strong buying pressure pushed the price from $55,113 to $61,706 in a single day. Unfortunately, this momentum was short-lived, as Bitcoin fell back below the $60,000 mark by August 11th, where it has remained.
Bitcoin 4-hour Chart Analysis: Symmetrical Triangle Pattern Emerges
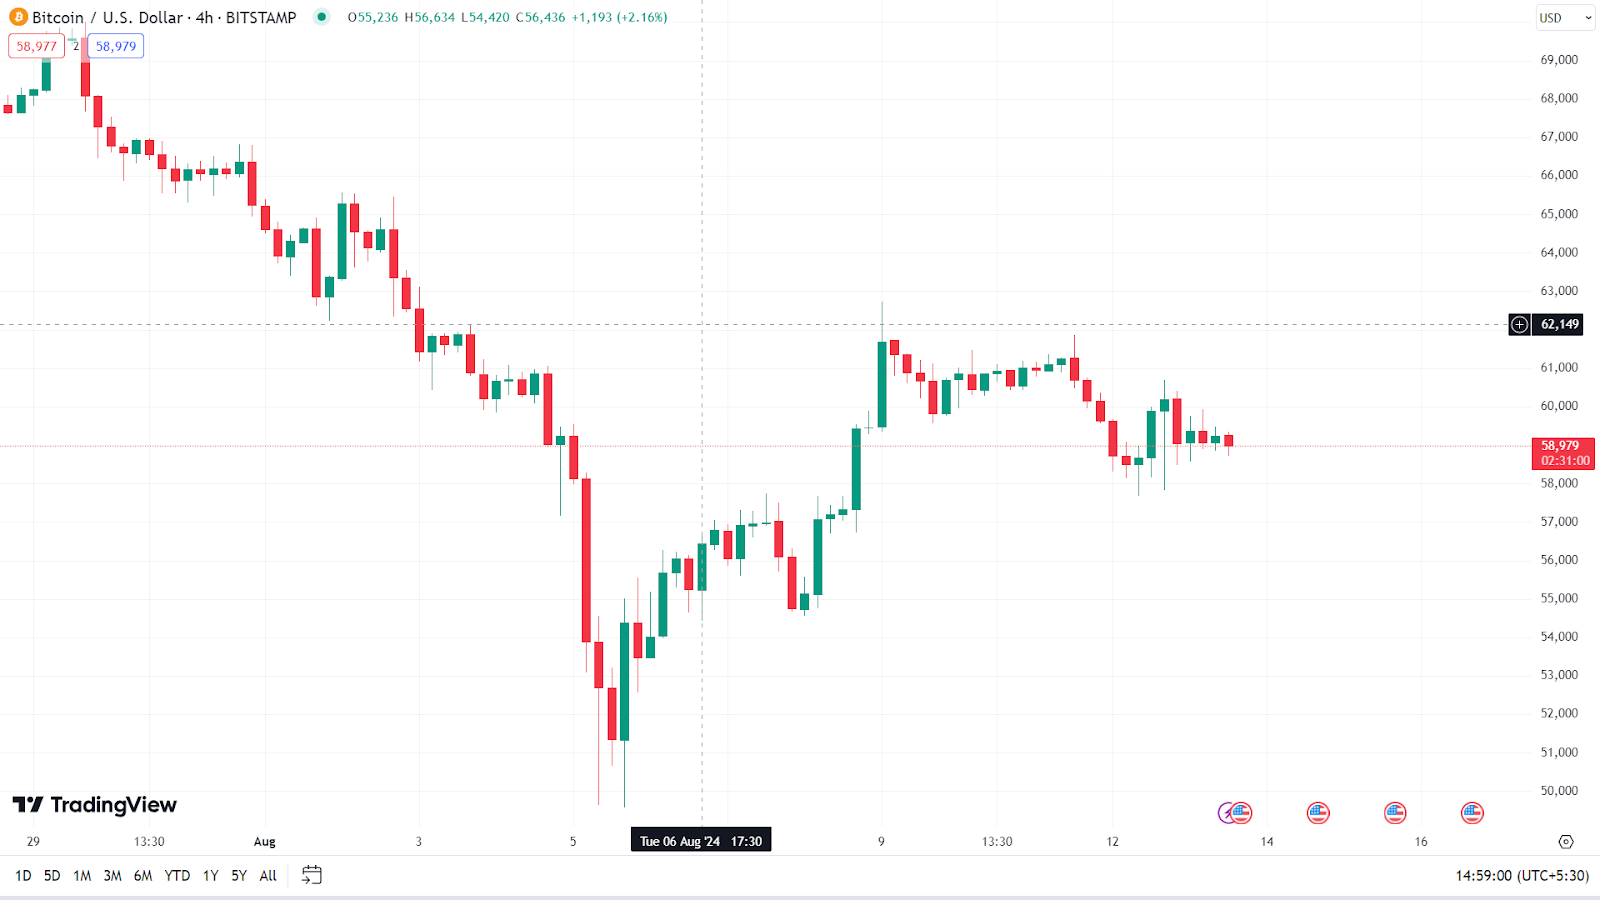
In the 4-hour Bitcoin chart, a symmetrical triangle pattern has formed, suggesting a potential breakout. The price dropped from $69,542 on July 29th to $51,365 by August 5th before buyers reentered the market, pushing the price up to $61,674 on August 9th. Since then, Bitcoin has been trading sideways, fluctuating between $61,710 and $58,505.

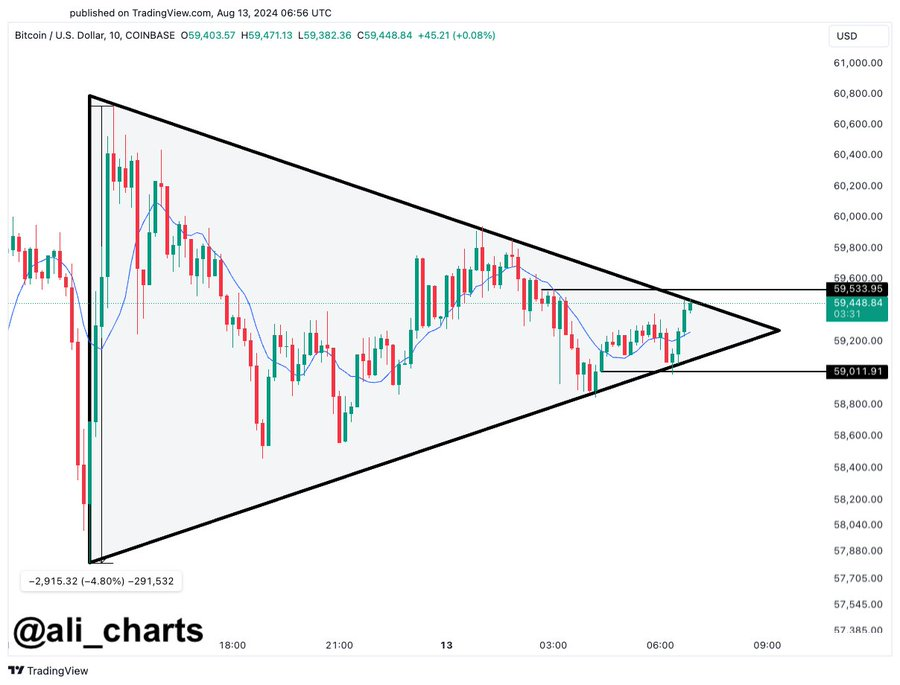
Bitcoin’s current symmetrical triangle pattern hints at a possible breakout. Traders should watch the $59,000 – $59,530 range closely, as a substantial close outside this range could trigger a significant price move, as per an expert identified as Ali Martinez in X.
Also Read: Markets Could Remain Highly Volatile: Here are the Cryptos to Monitor This Week

Be the first to comment