


Bitcoin fell back to the $91,000 zone on Tuesday after briefly reclaiming $94,000 a day earlier. Fresh data showed strong selling pressure near key resistance despite improving underlying demand indicators.
Sponsored
Heavy Sell Orders Capped Bitcoin’s Rally near $95,000
The pullback followed a failed attempt to break above the $94,000–$95,000 range, where order book data revealed nearly $100 million in sell orders stacked across major exchanges.
That concentration of liquidity acted as a ceiling, halting the rally and triggering short-term profit-taking.

The $91,000 zone for Bitcoin is an entry point for large volume of new buyers, who entered the market in early 2025. It seems that these buyers are booking short profits today after the recent volatility.
Order book heatmaps showed sellers absorbing buy pressure as Bitcoin entered the zone.
Once upside momentum stalled, leveraged traders exited positions, accelerating the drop toward $91,000. The move reflected market structure rather than a sudden shift in sentiment.
Sponsored
A Price Reversal is Still in the Books
Despite the pullback, on-chain and flow data suggest the broader trend remains constructive.
Data from CryptoQuant shows the Bitcoin-to-stablecoin reserve ratio on Binance has started rising again, signaling growing buying power sitting on the sidelines.
Sponsored
A higher ratio indicates that traders are holding stablecoins and waiting for favorable entry points, typically deploying capital during pullbacks rather than chasing breakouts.
This gradual buildup of liquidity often precedes consolidation phases, where price fluctuates within a range before making another directional move. It does not usually support sharp, vertical rallies in the short term.
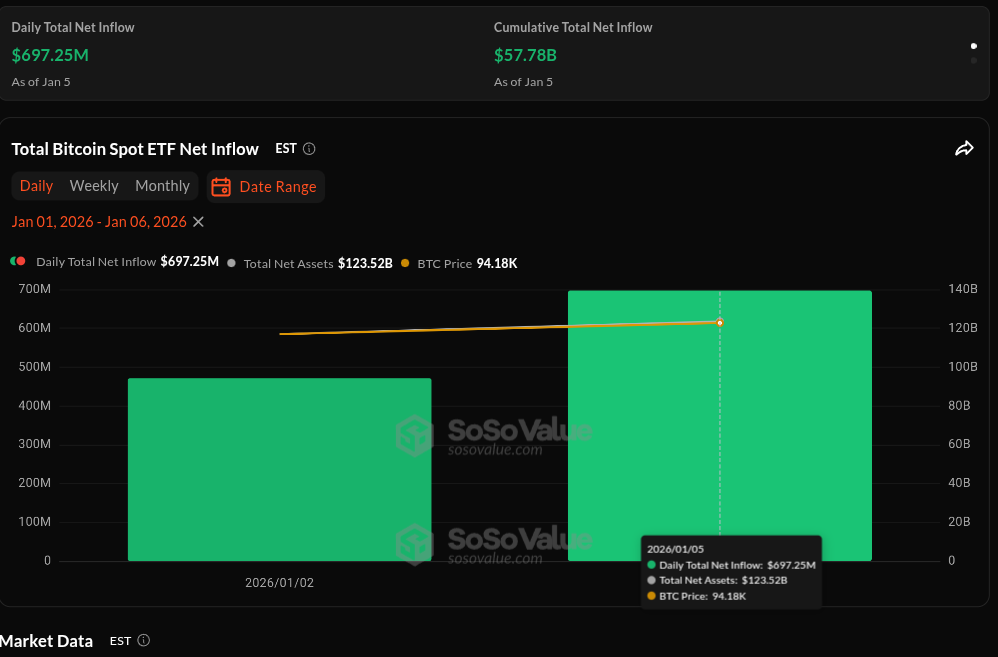
Institutional demand also remains intact. Spot Bitcoin ETFs recorded roughly $697 million in net inflows on Jan 5, pushing cumulative inflows close to $58 billion.
Sponsored
Importantly, these inflows continued even as Bitcoin struggled near resistance, suggesting long-term positioning rather than speculative momentum driving demand.
The contrast between strong ETF inflows and short-term price weakness highlights a growing divide in the market.
Long-term buyers continue to accumulate, while short-term traders react to technical levels and liquidity clusters.This dynamic explains why Bitcoin failed to sustain gains above $94,000 without triggering broader panic selling.
There were no signs of heavy exchange inflows or aggressive long-term holder distribution accompanying the drop.
For now, the data points toward consolidation rather than reversal. Clearing the $95,000 level will likely require sustained spot demand, thinner sell-side liquidity, and follow-through across risk markets.
Until then, pullbacks toward the low $90,000 range appear consistent with a market digesting recent gains.

Be the first to comment