



Bitcoin (BTC) starts the final week of August near its highest levels since mid-May as its bear-market recovery reaches a critical stage.
Key points:
Bitcoin sees a weekly candle close above its 50-week exponential moving average (EMA) for the first time since November 2025.Amid its best August gains in almost a decade, BTC/USD returns investor cohorts to net profit, while new money enters at $73,000.Fed chair Kevin Warsh is in the spotlight ahead of the Jackson Hole symposium.US PCE data will be released on Wednesday as markets continue to respond to last week’s US Treasury debt buyback.Investor capital returns to exchange-traded products as Bitcoin ETF netflows hit $1.9 billion last week.
Bitcoin scrapes weekly close above key resistance

Bitcoin reached $79,550 last week, its highest levels since early May as a five-day rally brought gains of up to 27%. BTC/USD closed last week at $77,727 on Bitstamp, per data from TradingView. This signified a reclaim of its 50-week exponential moving average (EMA), a key resistance trendline that currently sits at $77,752.
The 50-week EMA is commonly brought into focus by traders during Bitcoin bear markets. The last candle close above this crucial line of resistance was in early November 2025. In prior bear markets, BTC has retested the 50-week EMA before capitulating into its ultimate macro lows. This has meant some traders remain unconvinced by last week’s strong price action.
BTC/USD one-week chart with 50 EMA. Source: Cointelegraph/TradingView
Prior to the close, crypto trader and analyst Rekt Capital warned that not only the 50-week EMA but the entire area around $80,000 figured as resistance for bulls to overcome, while price so far has topped out lower.
“Each Bear Market Relief Rally thus far would retrace sharply in the week following a strong breakout rally,” he wrote in ongoing X analysis.
“Next weeks will be crucial. But maybe even already next week we’ll know whether Bitcoin can sustain these highs or not.”
An accompanying chart showed what Rekt Capital subsequently called a series of macro lower highs, potentially reinforcing the bear market despite recent strength.
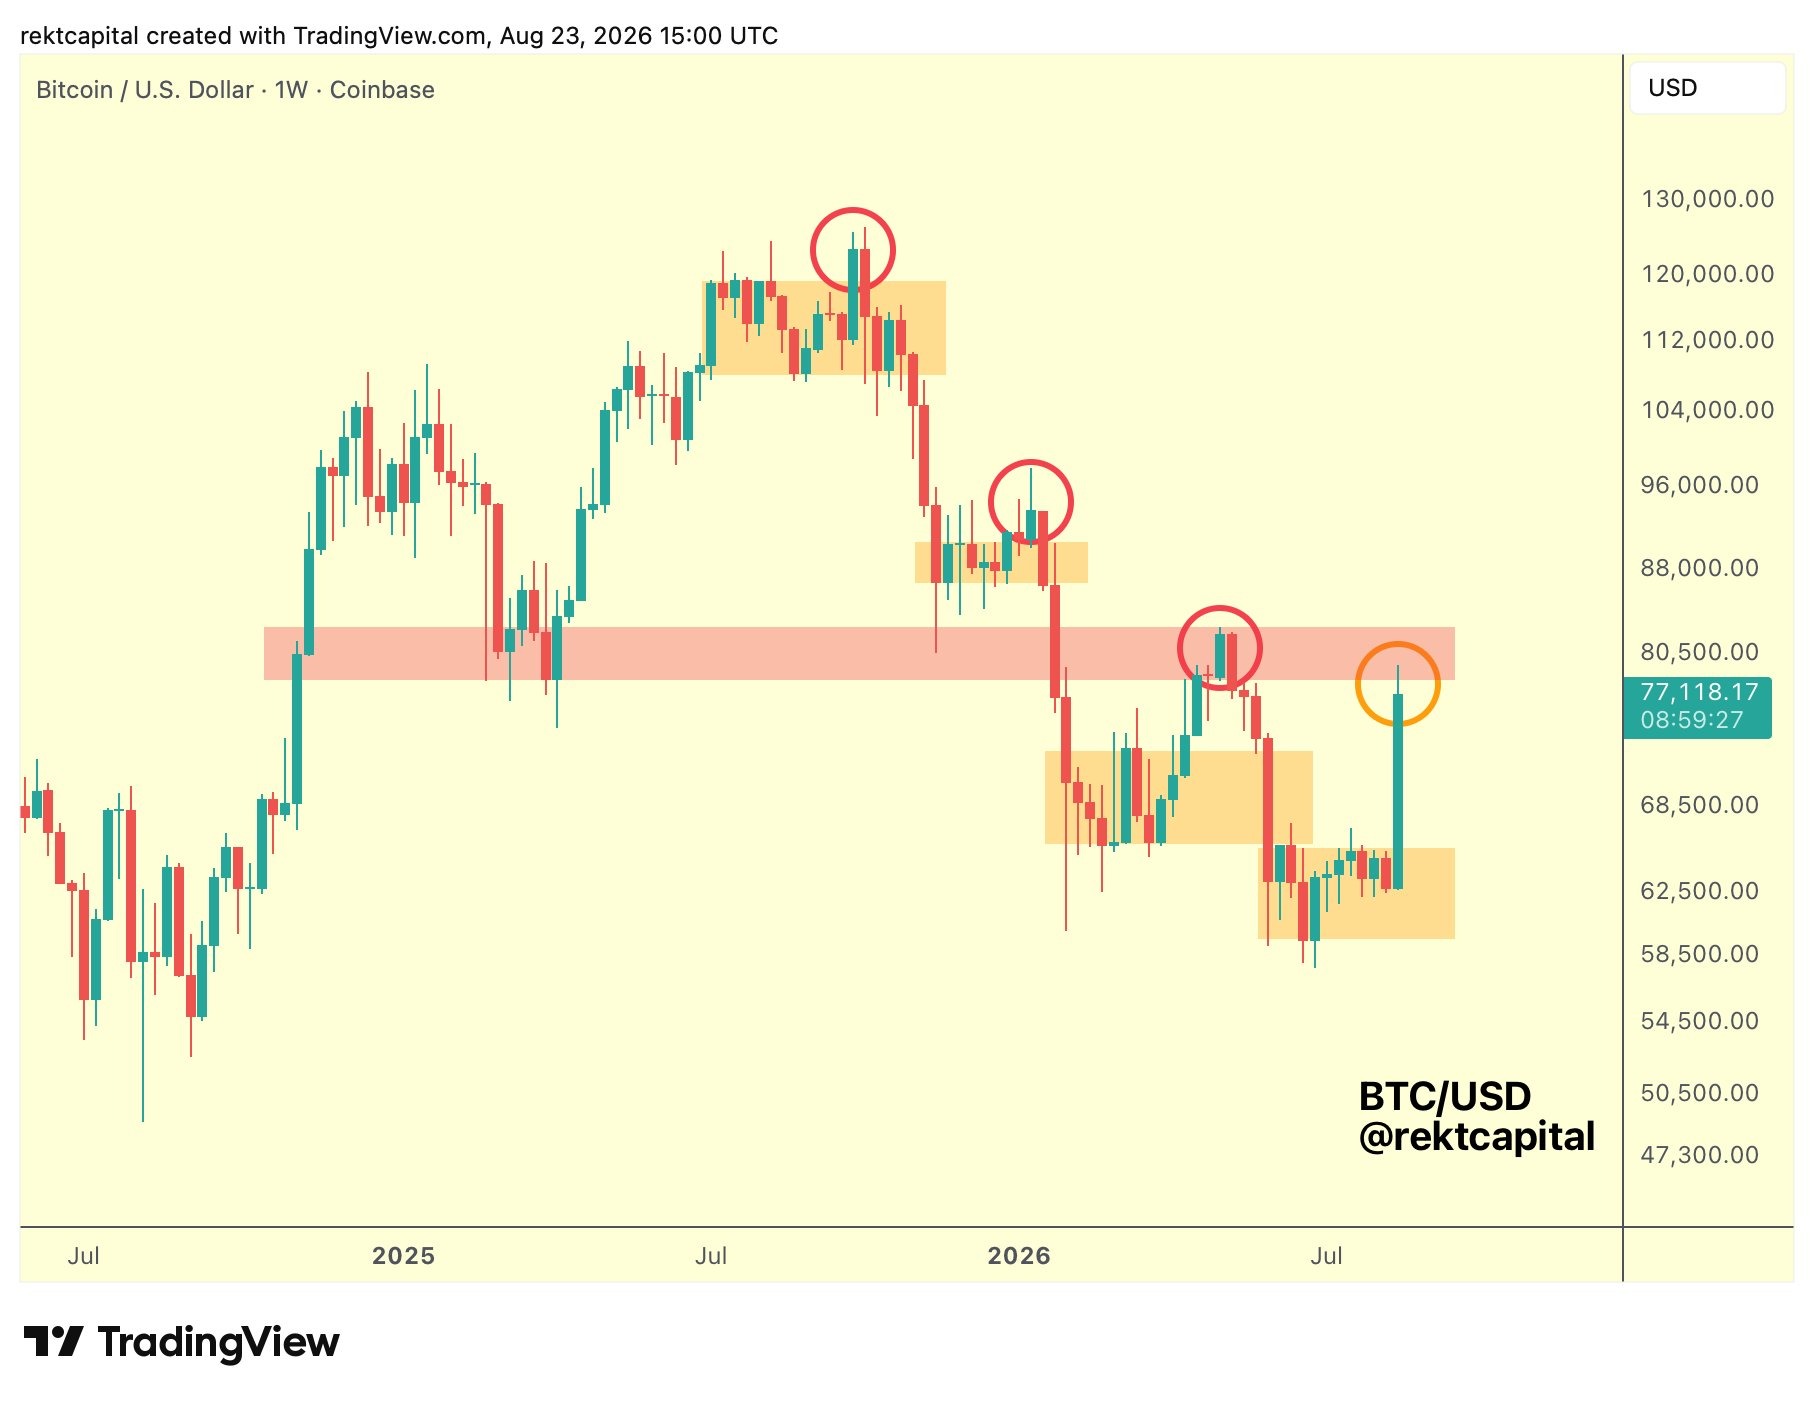
BTC/USD one-week chart. Source: Rekt Capital on X.com
Earlier, Cointelegraph reported on traders’ expectations of 2026 playing out in a similar manner to previous bear markets, with 2022 showing the most similarities in terms of timing.
“If history repeats, Bitcoin will try to get as close as possible to ~$93,000 in 2027. But first, Bitcoin needs to fully confirm its Bear Market bottom and fully confirm a break of the Macro Downtrend,” Rekt Capital added.
BTC price on track for best August in nine years
Bitcoin consolidated over the weekend, with price circling $77,500 at the time of writing, still up 22% month-to-date in its best performing August since 2017, per data from CoinGlass.
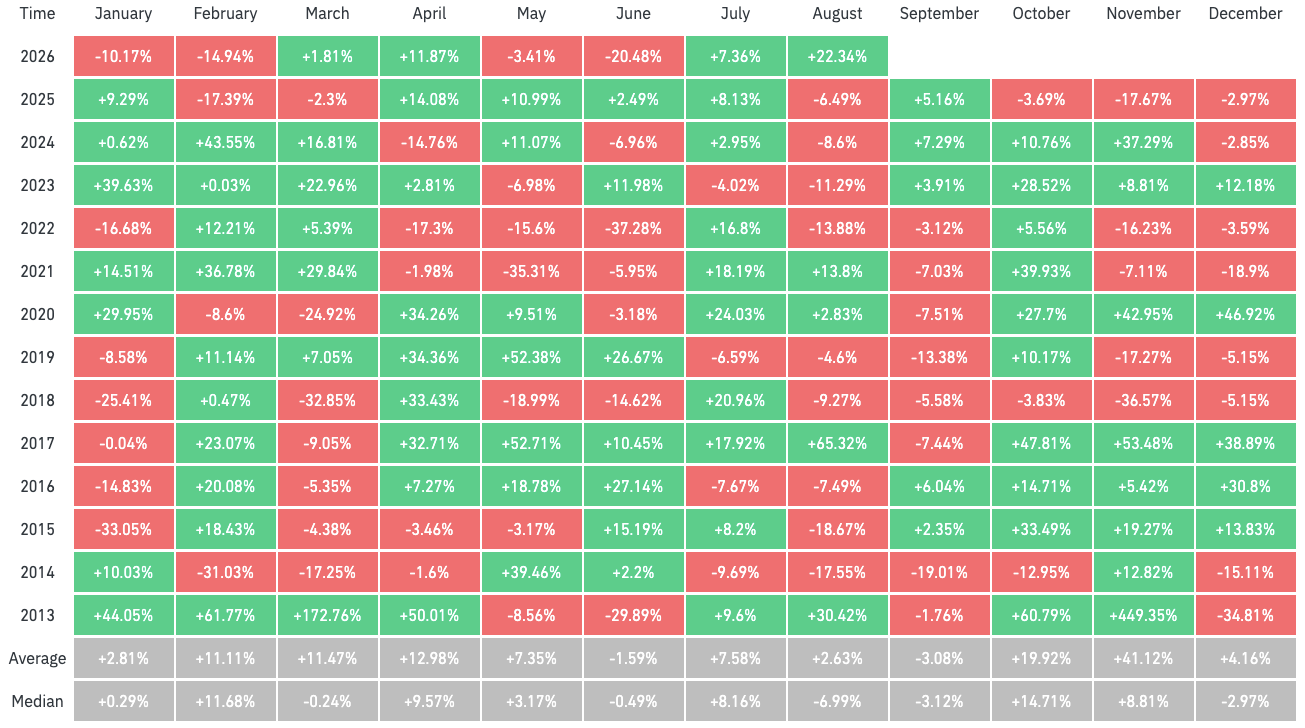
BTC/USD monthly returns (screenshot). Source: CoinGlass
The run-up saw the weekly candle reclaim several key price points, including the aggregate cost basis for short-term holders (STHs) — wallets holding a UTXO for less than 155 days — at $68,700. Onchain analytics platform CryptoQuant thus calculated STH net profitability at just over 11%.
“At the same time, Long-Term Holder profitability moved from approximately breakeven to +18.5%, while New Money profitability rose from -1.4% to +12.7%,” it reported on Monday.
Examining the cost basis of UTXOs as a whole, CryptoQuant noted that so-called “new money” now has a breakeven point at $73,000, above both the STH and LTH cost basis, leaving less margin for downside protection should BTC/USD reverse to attempt to find new support lower.
“That makes the 68K-73K region the key area to watch. Holding above it would suggest that the profitability reset is becoming structurally durable. Losing it would quickly push a large portion of recent buyers back into loss,” it added.
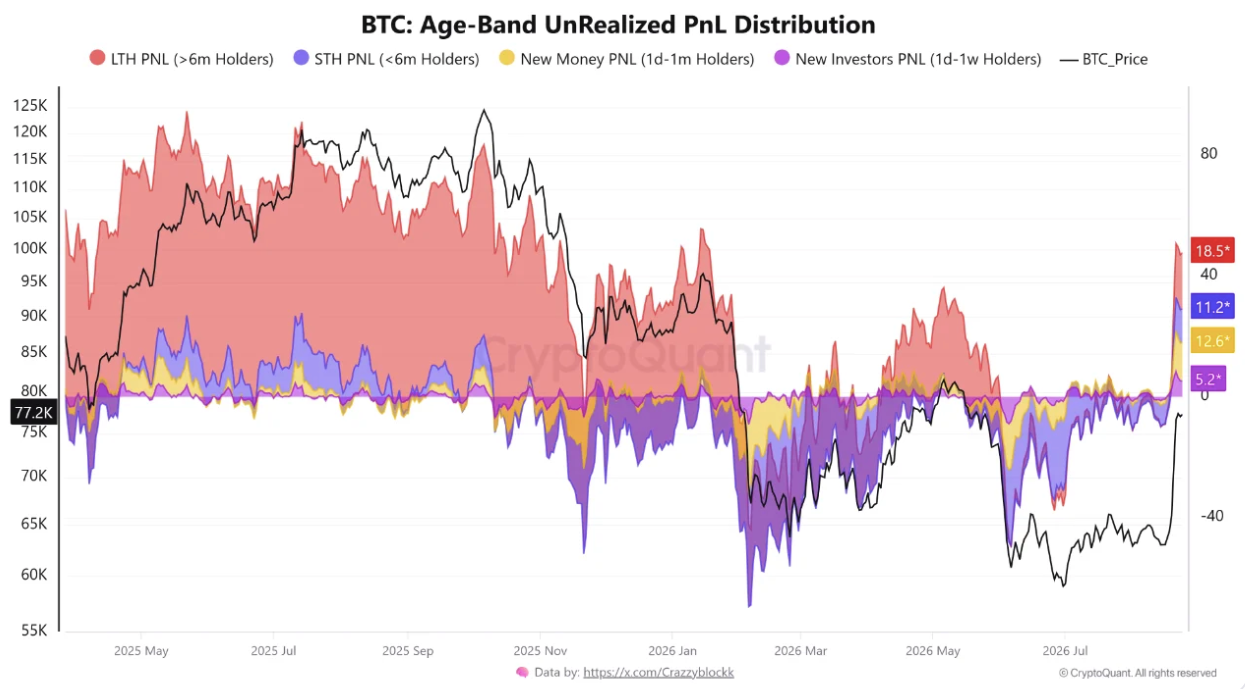
Bitcoin UTXO distribution by cohort age (screenshot). Source: CryptoQuant
Fed’s Warsh faces the music at Jackson Hole
All eyes are on the Federal Reserve and chair Kevin Warsh this week as the annual Jackson Hole economic symposium gets underway.
The event, which will feature central bankers from over 70 countries, sees Warsh’s first keynote speech as Fed chair and his first public speaking appearance since the press conference that followed the July Federal Open Market Committee (FOMC) meeting.
Warsh has maintained a tight-lipped stance on financial policy, especially when it comes to future interest-rate changes — a topic to which crypto and risk assets are sensitive. Recent inflation data has supported a softening of policy going forward, but the ever-present threat of oil-price spikes from the US-Iran war has kept markets wary.
The latest data from CME Group’s FedWatch Tool shows 63.1% odds of rates remaining at their current 3.50-3.75% level after the September FOMC meeting.
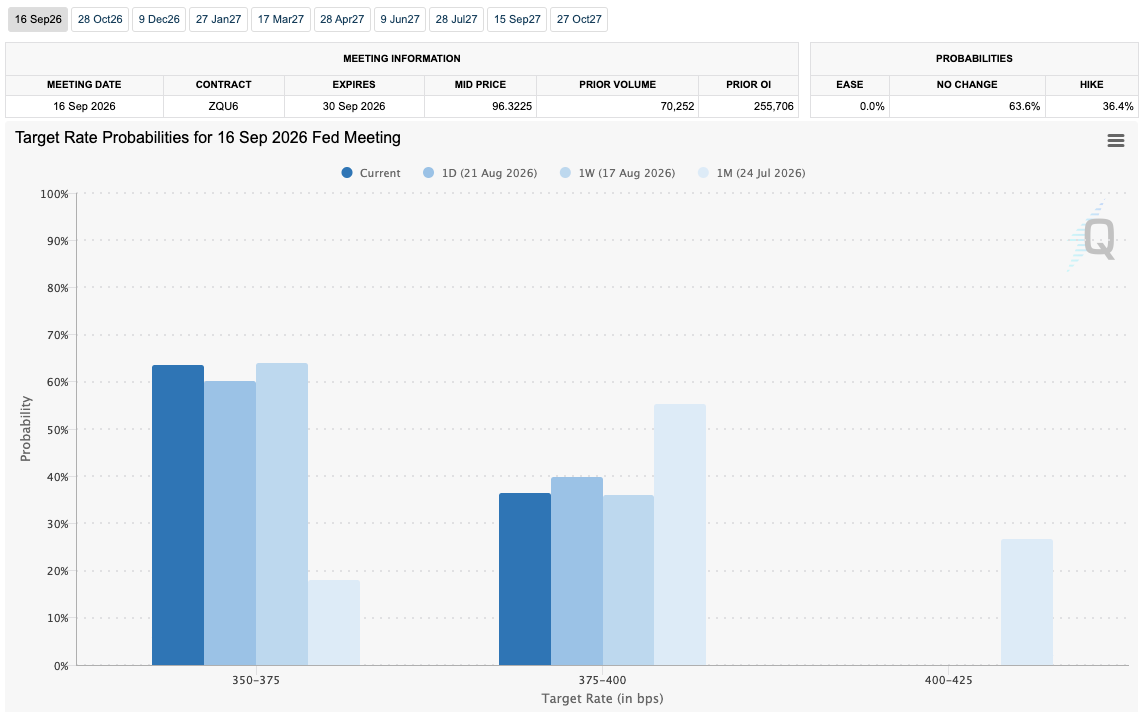
Fed target-rate probability comparison for September FOMC meeting (screenshot). Source: CME Group
Speaking to CNBC last week, Thierry Wizman, global foreign exchange and rates strategist at Macquarie Group, warned that Warsh now had to juggle the influence of the Treasury with his plan to reduce the market involvement of the Fed.
Wizman told the network that “were Warsh to signal that he would stay ‘dovish’ indefinitely, it could be self-defeating for him and the Treasury, since inflation breakevens would rise further, perhaps undoing the stability in the nominal long-term yields that [Treasury Secretary] Scott Bessent is trying to achieve.”
A survey of fund managers by Bank of America, quoted by Barchart and others, produced 72% odds of no rate hikes occurring before the US midterm elections in November. On policy, consensus coalesced around a “no landing” scenario over the next 12 months — where the economy avoids recession amid strong growth and low unemployment.
Yield curve control talk returns after Treasury debt move
Beyond geopolitics, a move by the US Treasury last week to at least double the size of its debt buyback purchases to $4 billion per operation was the key market mover last week. The announcement sparked a Bitcoin short squeeze that went on to wipe out a record $3.1 billion of crypto short positions over two days.
The extent of the reaction sparked suggestions that Bitcoin was once again anticipating global liquidity-regime changes amid the rising cost of government debt financing worldwide.
“The intervention ignited a move in assets sensitive to the outlook for liquidity, including gold and Bitcoin. That hints at market concerns over currency debasement should measures like quantitative easing make a return to contain interest rates,” trading resource Mosaic Asset Company wrote in the latest edition of its regular newsletter, The Market Mosaic.
Mosaic argued that the intervention represented not a mere liquidity move but a form of yield curve control (YCC), with short-term bonds issued to cover the cost of the added buybacks. Crypto commentators have long expected YCC to be all but guaranteed to prevent government bankruptcy.
“YCC is the end game. When it is finally implicitly or explicitly declared, it’s game over for the value of the USD vs. gold and more importantly Bitcoin,” Arthur Hayes, former CEO of crypto exchange BitMEX, forecast in a 2022 blog post.
“YCC is how we get to $1 million Bitcoin and $10,000 to $20,000 gold.”
The day prior to Warsh’s appearance, meanwhile, brings a crucial piece of US macroeconomic data that could skew the mood for markets.
The July print of the Personal Consumption Expenditures (PCE) index, due for release on Wednesday, is known to be the Fed’s “preferred” inflation gauge. In June it saw its first month-on-month drop since 2020.
Consensus around the upcoming print is for a 0.1% monthly increase, with the year-on-year increase cooling further to 3.6% versus 3.7% in June.
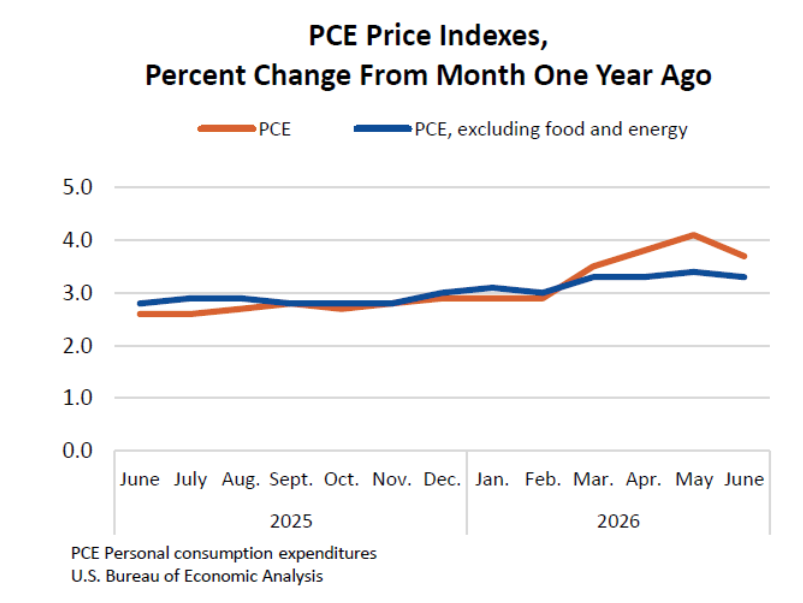
PCE index one-month % change (screenshot). Source: US Bureau of Economic Analysis
Bitcoin ETFs see strongest inflows in 10 months
Crypto fund inflows remain highly reactive to price volatility, with last week’s inflows to the US spot Bitcoin exchange-traded funds (ETFs) breaking records.
Related: Bitcoin has ‘largely purged’ froth that preceded 50% drop from $126K: BlackRock
Data from UK-based investment company Farside Investors shows the ETF cohort taking in $1.9 billion over the week’s five trading days — the strongest weekly tally since October 2025, when Bitcoin hit its latest all-time highs of $126,200.
Thursday saw particularly strong performance as BTC/USD extended gains beyond $70,000, with BlackRock’s ETF, the iShares Bitcoin Trust (IBIT), seeing net inflows of more than half a billion dollars.
“We saw net inflows on every trading day last week, which suggests renewed investor interest in Bitcoin,” Gracie Lin, chief executive officer of crypto exchange OKX SG, told Bloomberg.
“The question now is whether that momentum will hold. After such a strong move in Bitcoin, some profit-taking wouldn’t be surprising.”
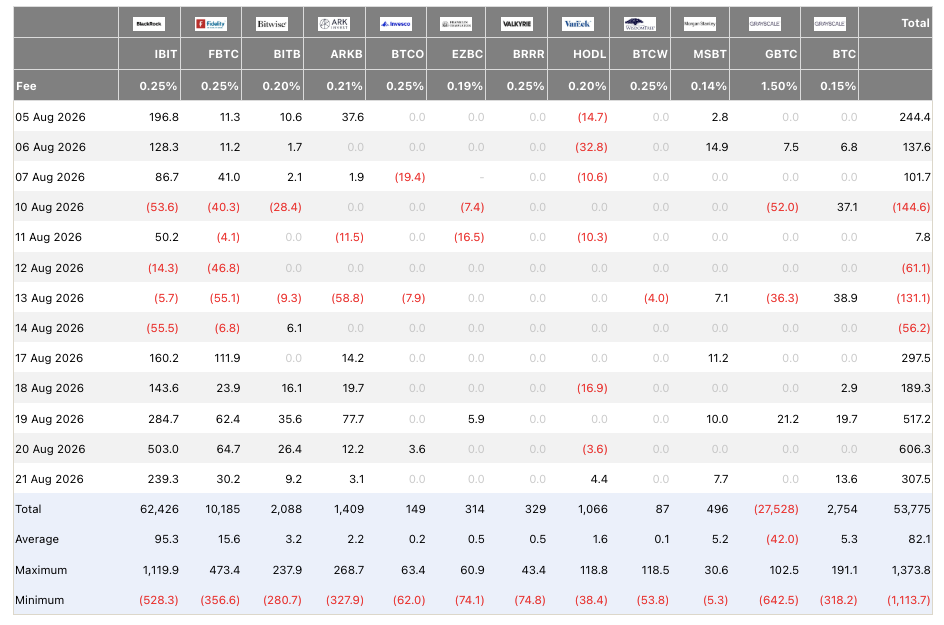
US spot Bitcoin ETF netflows (screenshot). Source: Farside Investors
The results heavily contrast with activity just two months ago, with June seeing unprecedented net outflows of more than $4.5 billion. At the end of last week, total August inflows stood at $2.38 billion, a new year-to-date record.



Be the first to comment