


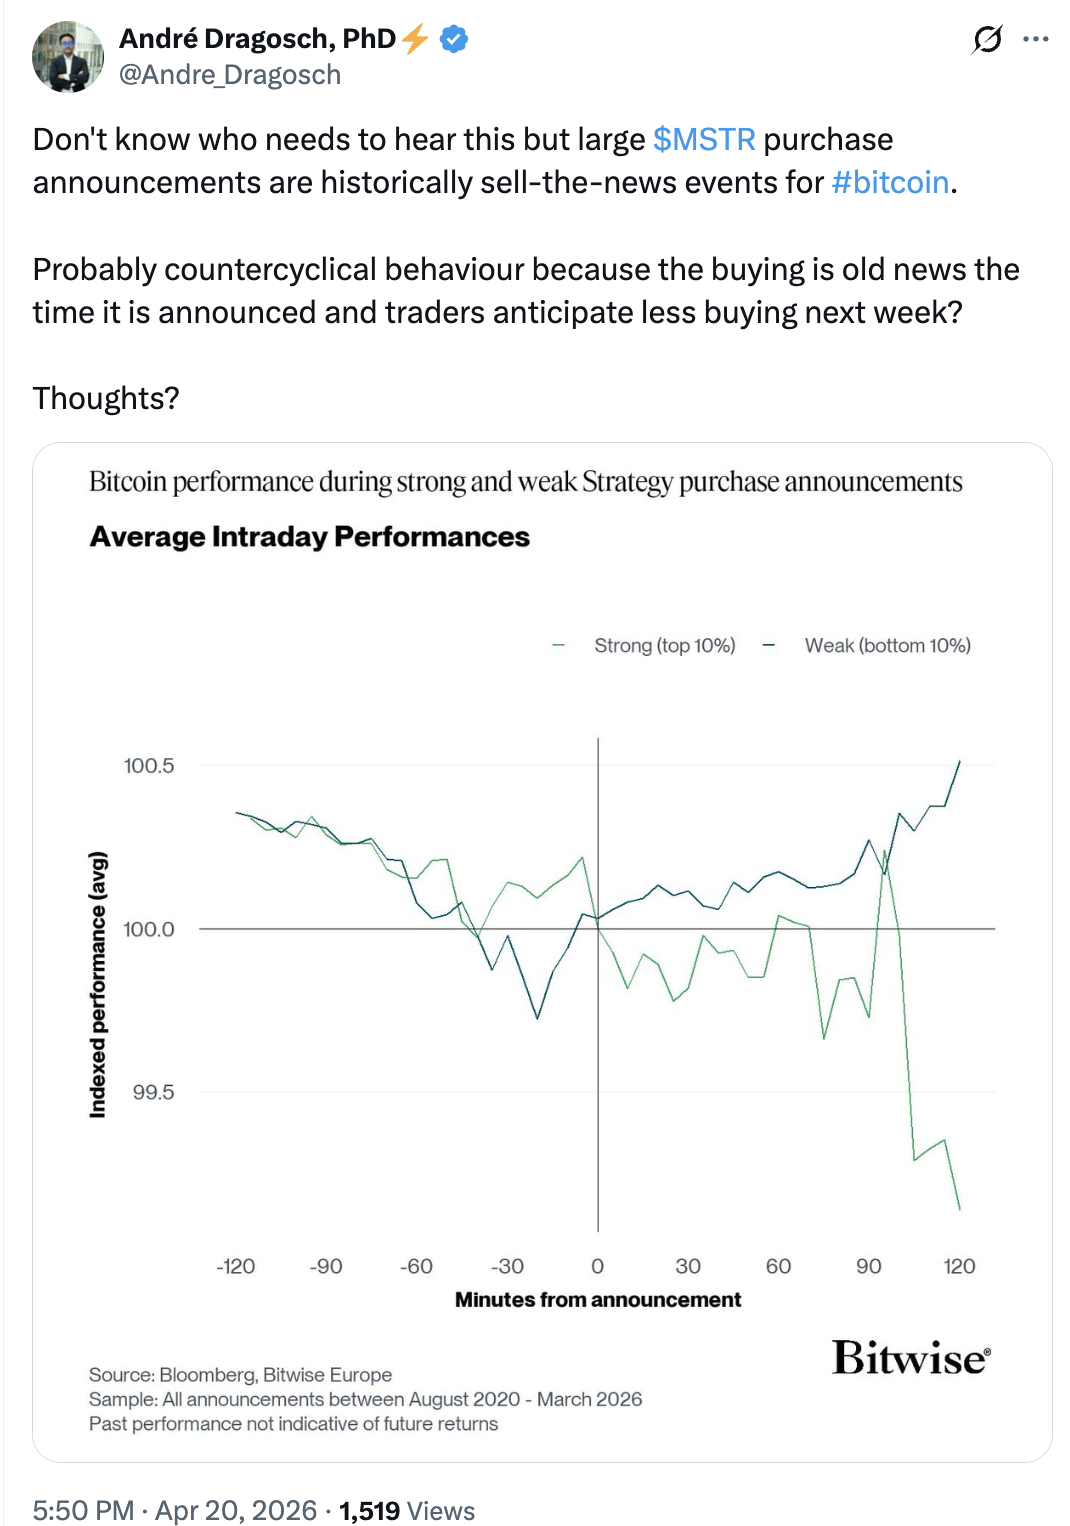
Bitcoin (BTC) rose 2.66% to around $75,800 on Monday after Strategy disclosed a $2.54 billion purchase, the company’s third biggest ever, and equivalent to about 2.5 months of new BTC supply.
However, several indicators suggest the rally may fizzle out.
BTC/USD daily chart. Source: TradingView
Key takeaways:

Poor macro conditions can spark BTC price pullback if Strategy’s buying slows.Bitcoin’s technical setup hints at a potential dip toward $67,000–$69,000.
Strategy may halt BTC purchases this week
Strategy funded most of its latest 34,164 BTC purchase through its preferred stock, Stretch (STRC), which generated over $2.17 billion through at-the-market share sales between April 13 and April 19.
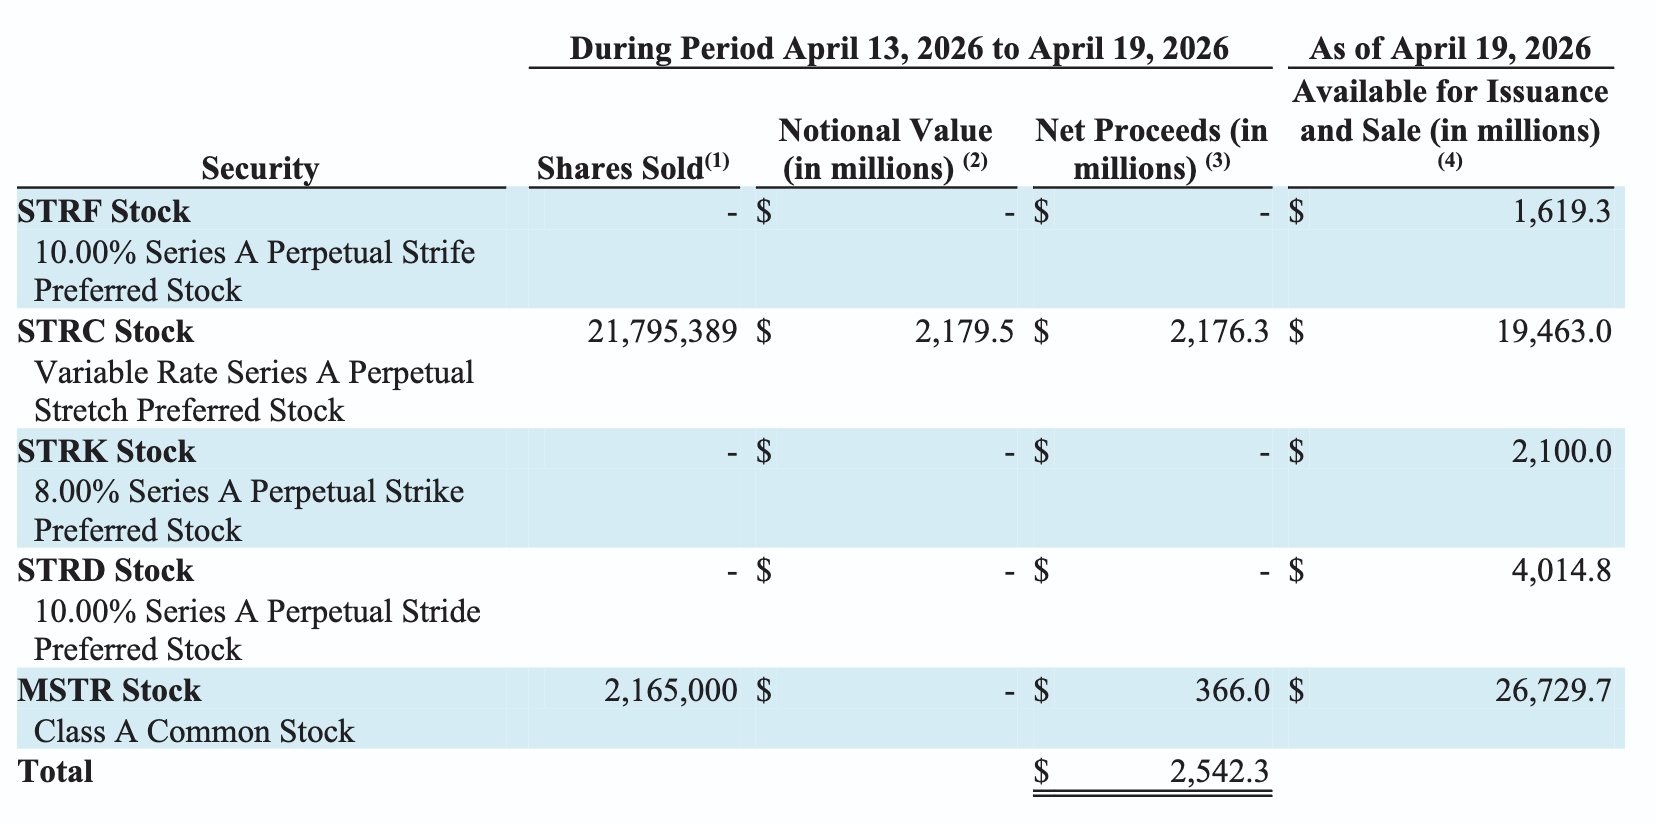
Source: Strategy’s SEC Filings
That accounted for roughly 86% of the total amount spent, while sales of its Class A common stock, MSTR, added another $366 million.
STRC lets Strategy raise cash for Bitcoin when it trades at or above $100. Stronger prices mean easier fundraising and more BTC buying. In 2026, STRC enabled the purchases of 77,000 BTC, ten times more than all the ETFs combined, per River data.
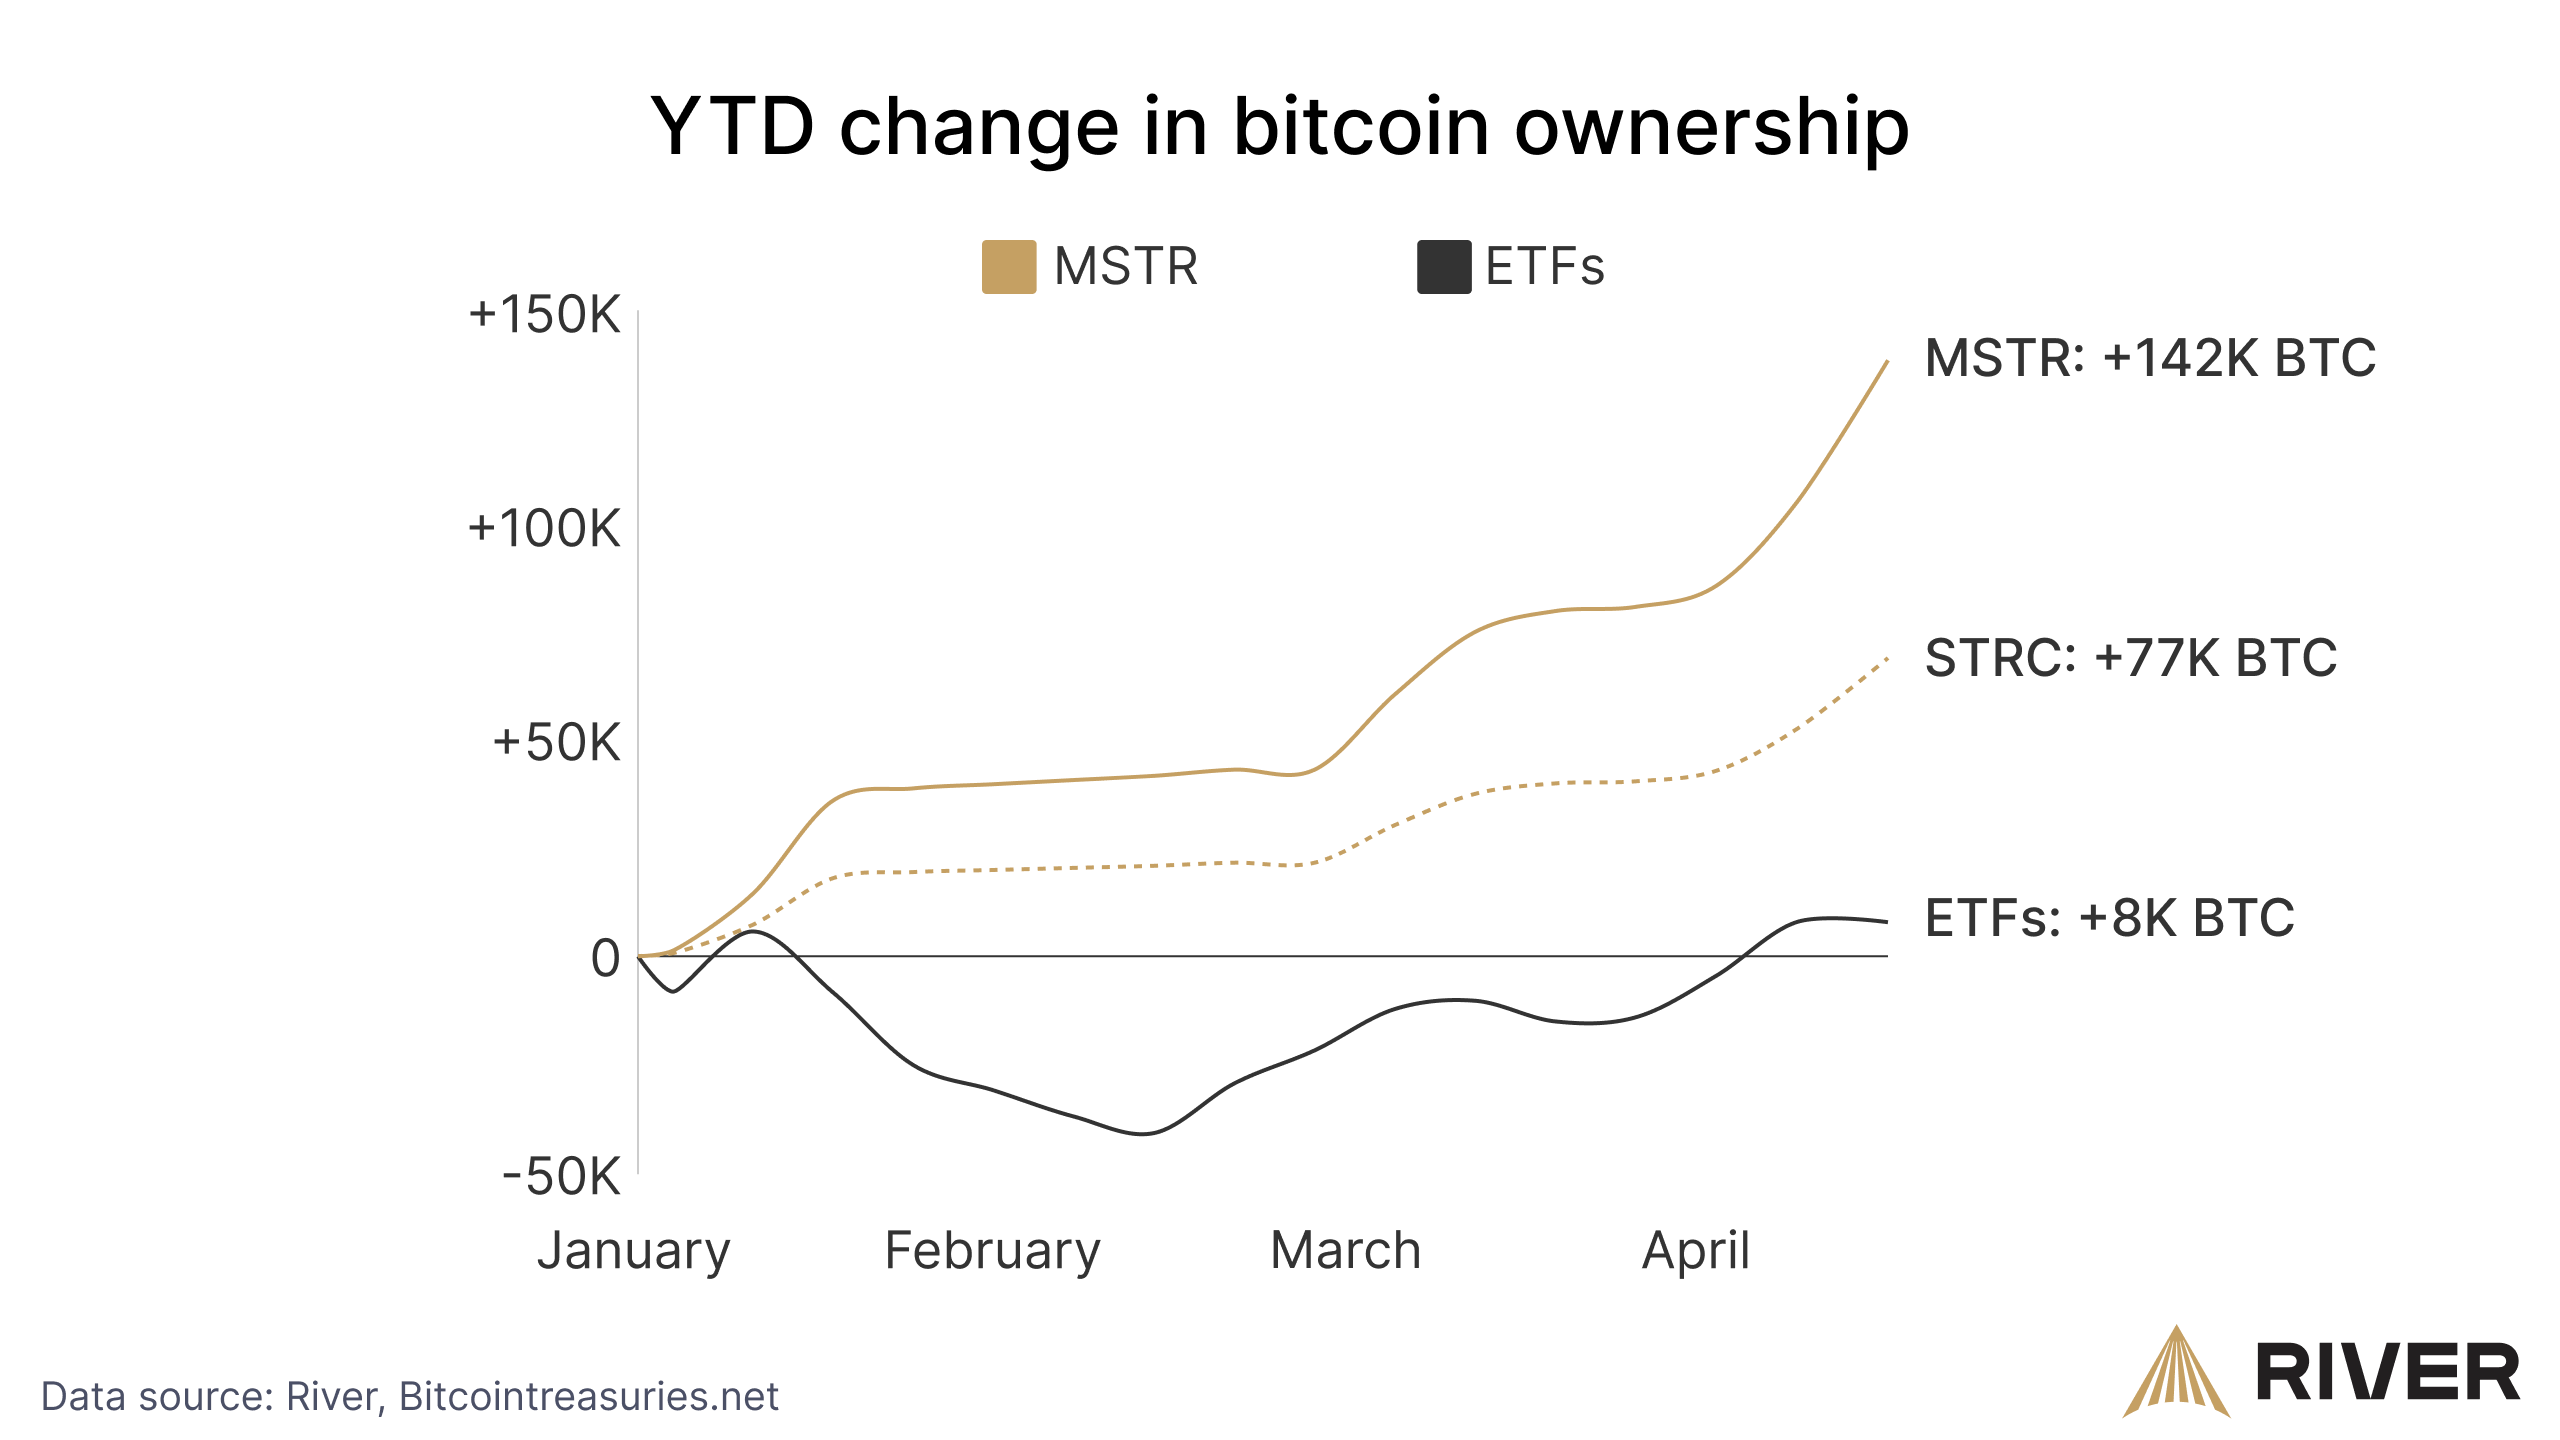
Bitcoin ownership YTD change. Source: River
But STRC has been trading below its $100 par value since April 15, which may limit Strategy’s ability to keep raising cash to purchase more Bitcoin this week.
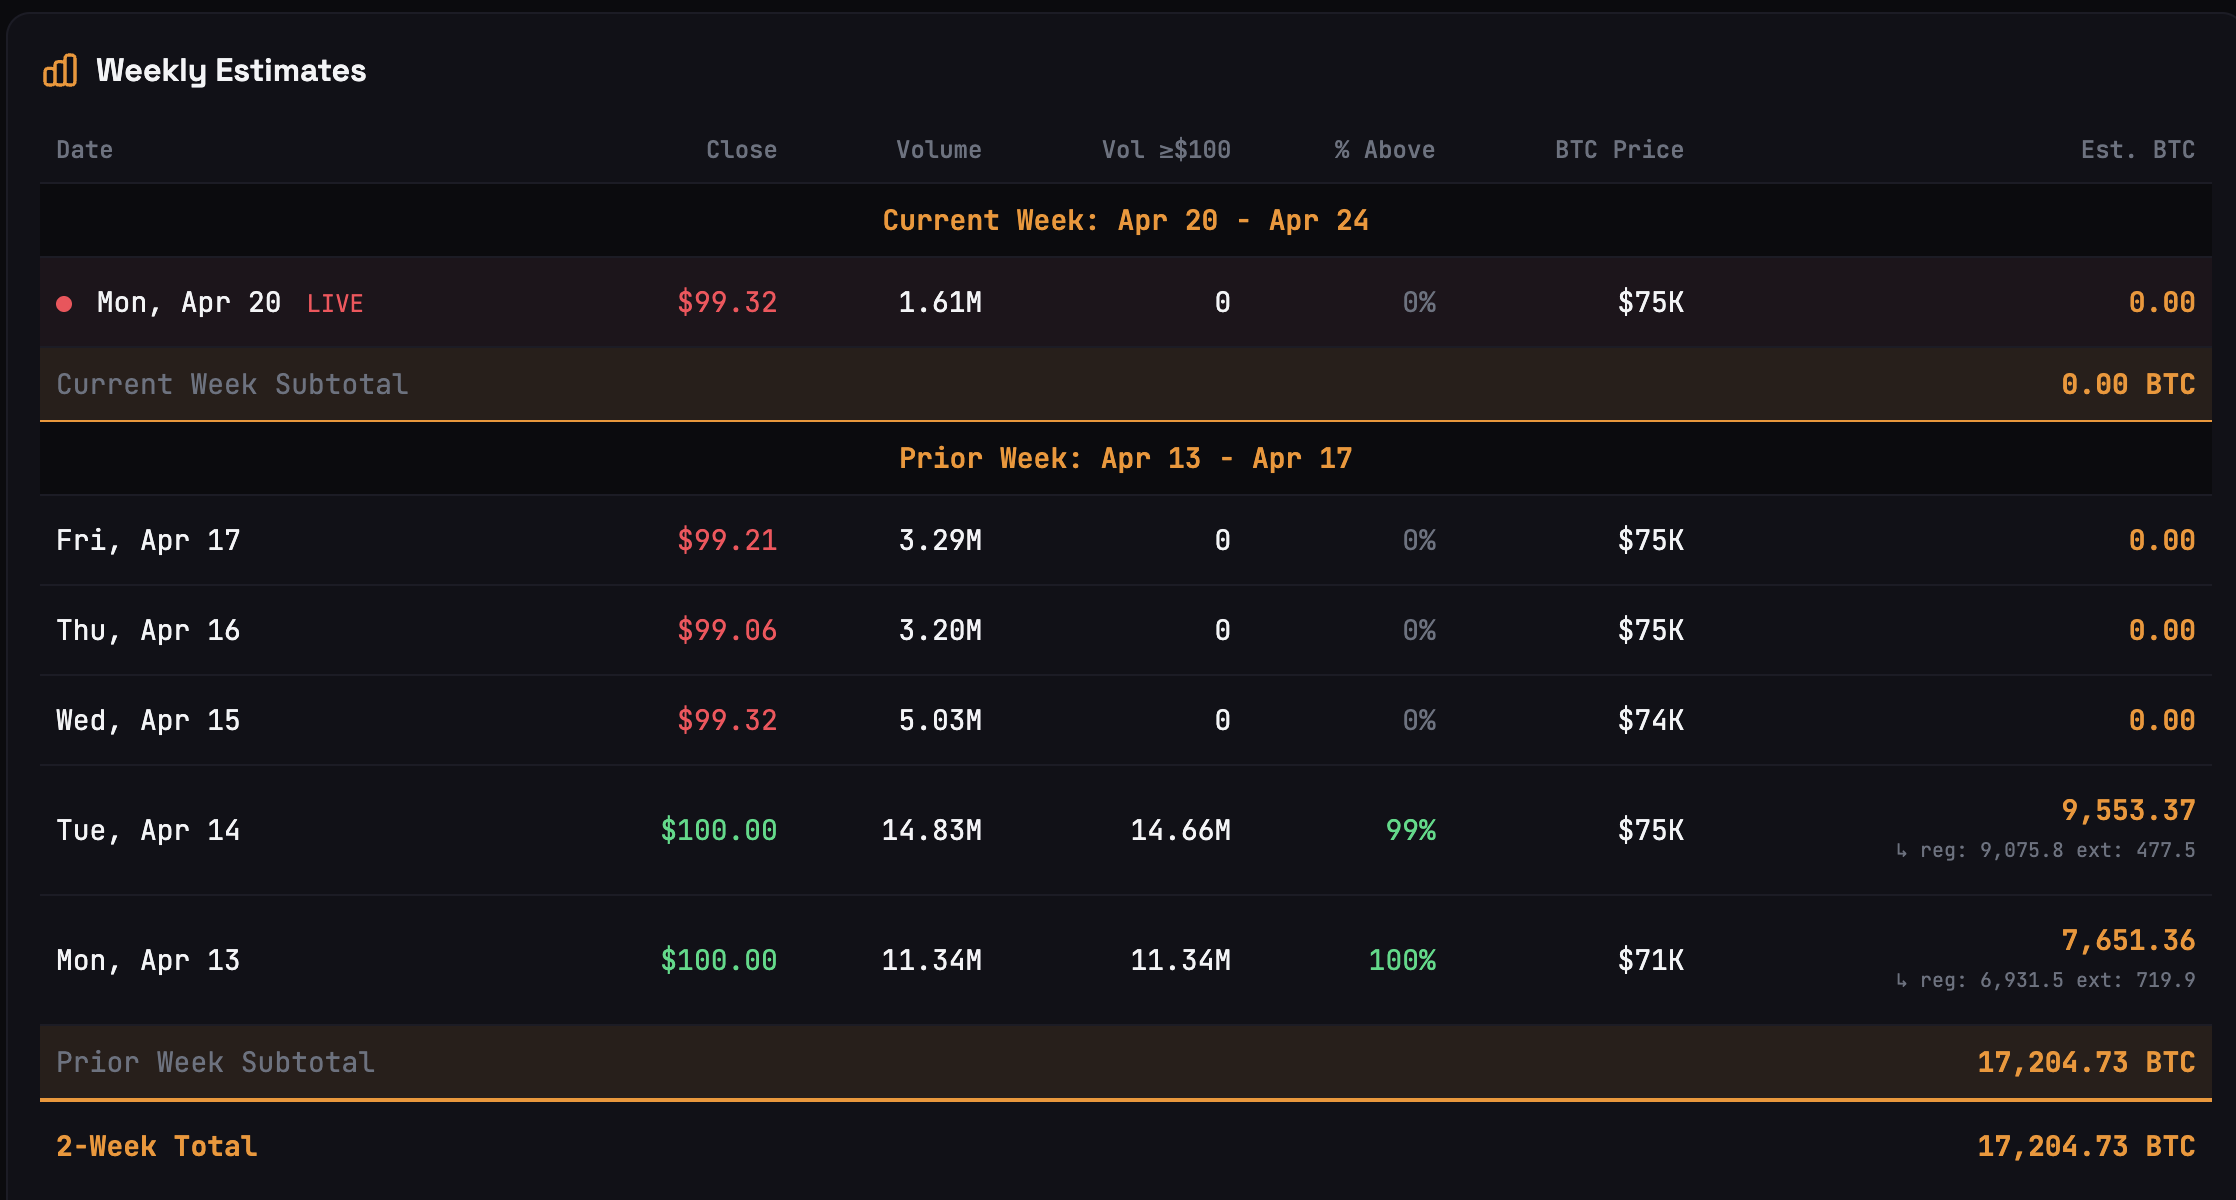
STRC weekly estimates. Source: STRC.LIVE
In past episodes, pauses in Strategy’s Bitcoin purchases have coincided with BTC price slumps.
For instance, on average, BTC’s price has dipped by roughly 30% when STRC traded below its $100 par value.
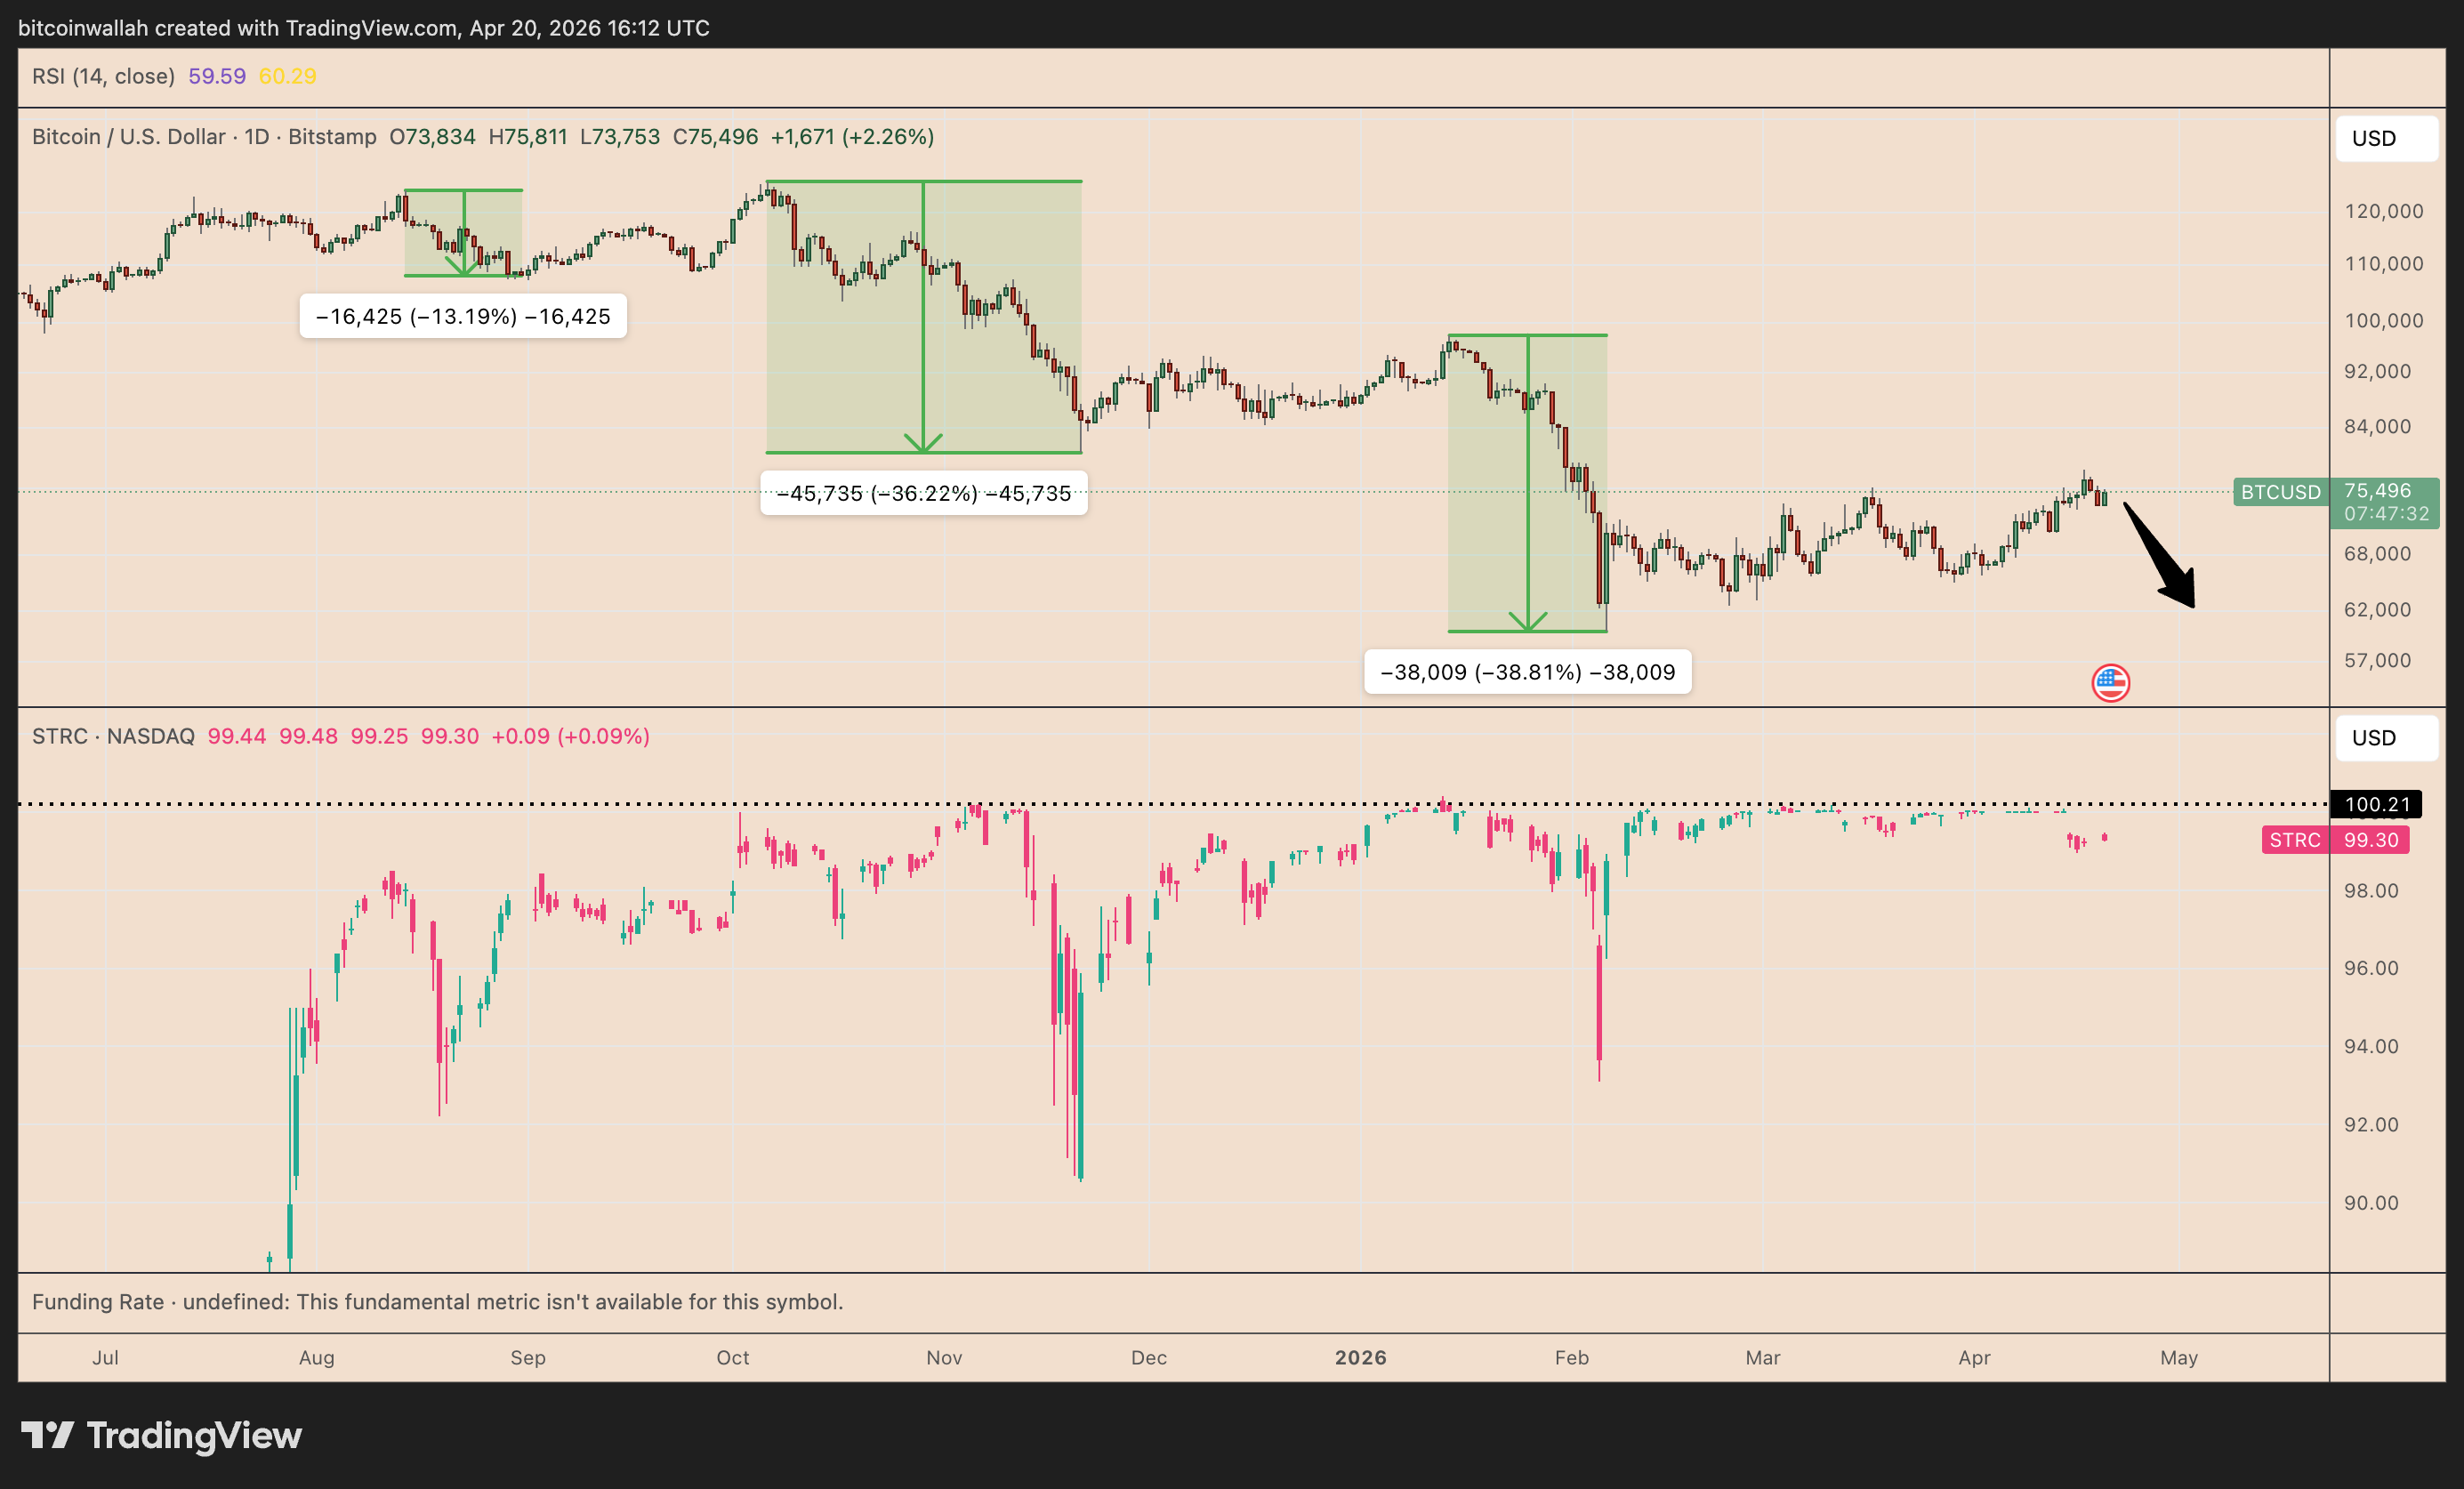
BTC/USD vs. STRC daily performance chart. Source: TradingView
A 30% dip will take Bitcoin’s price to $53,000 when measured from current levels.
Source: X
The halt appears alongside weakening risk sentiment, with US stock indexes falling amid doubts over the US–Iran peace deal.
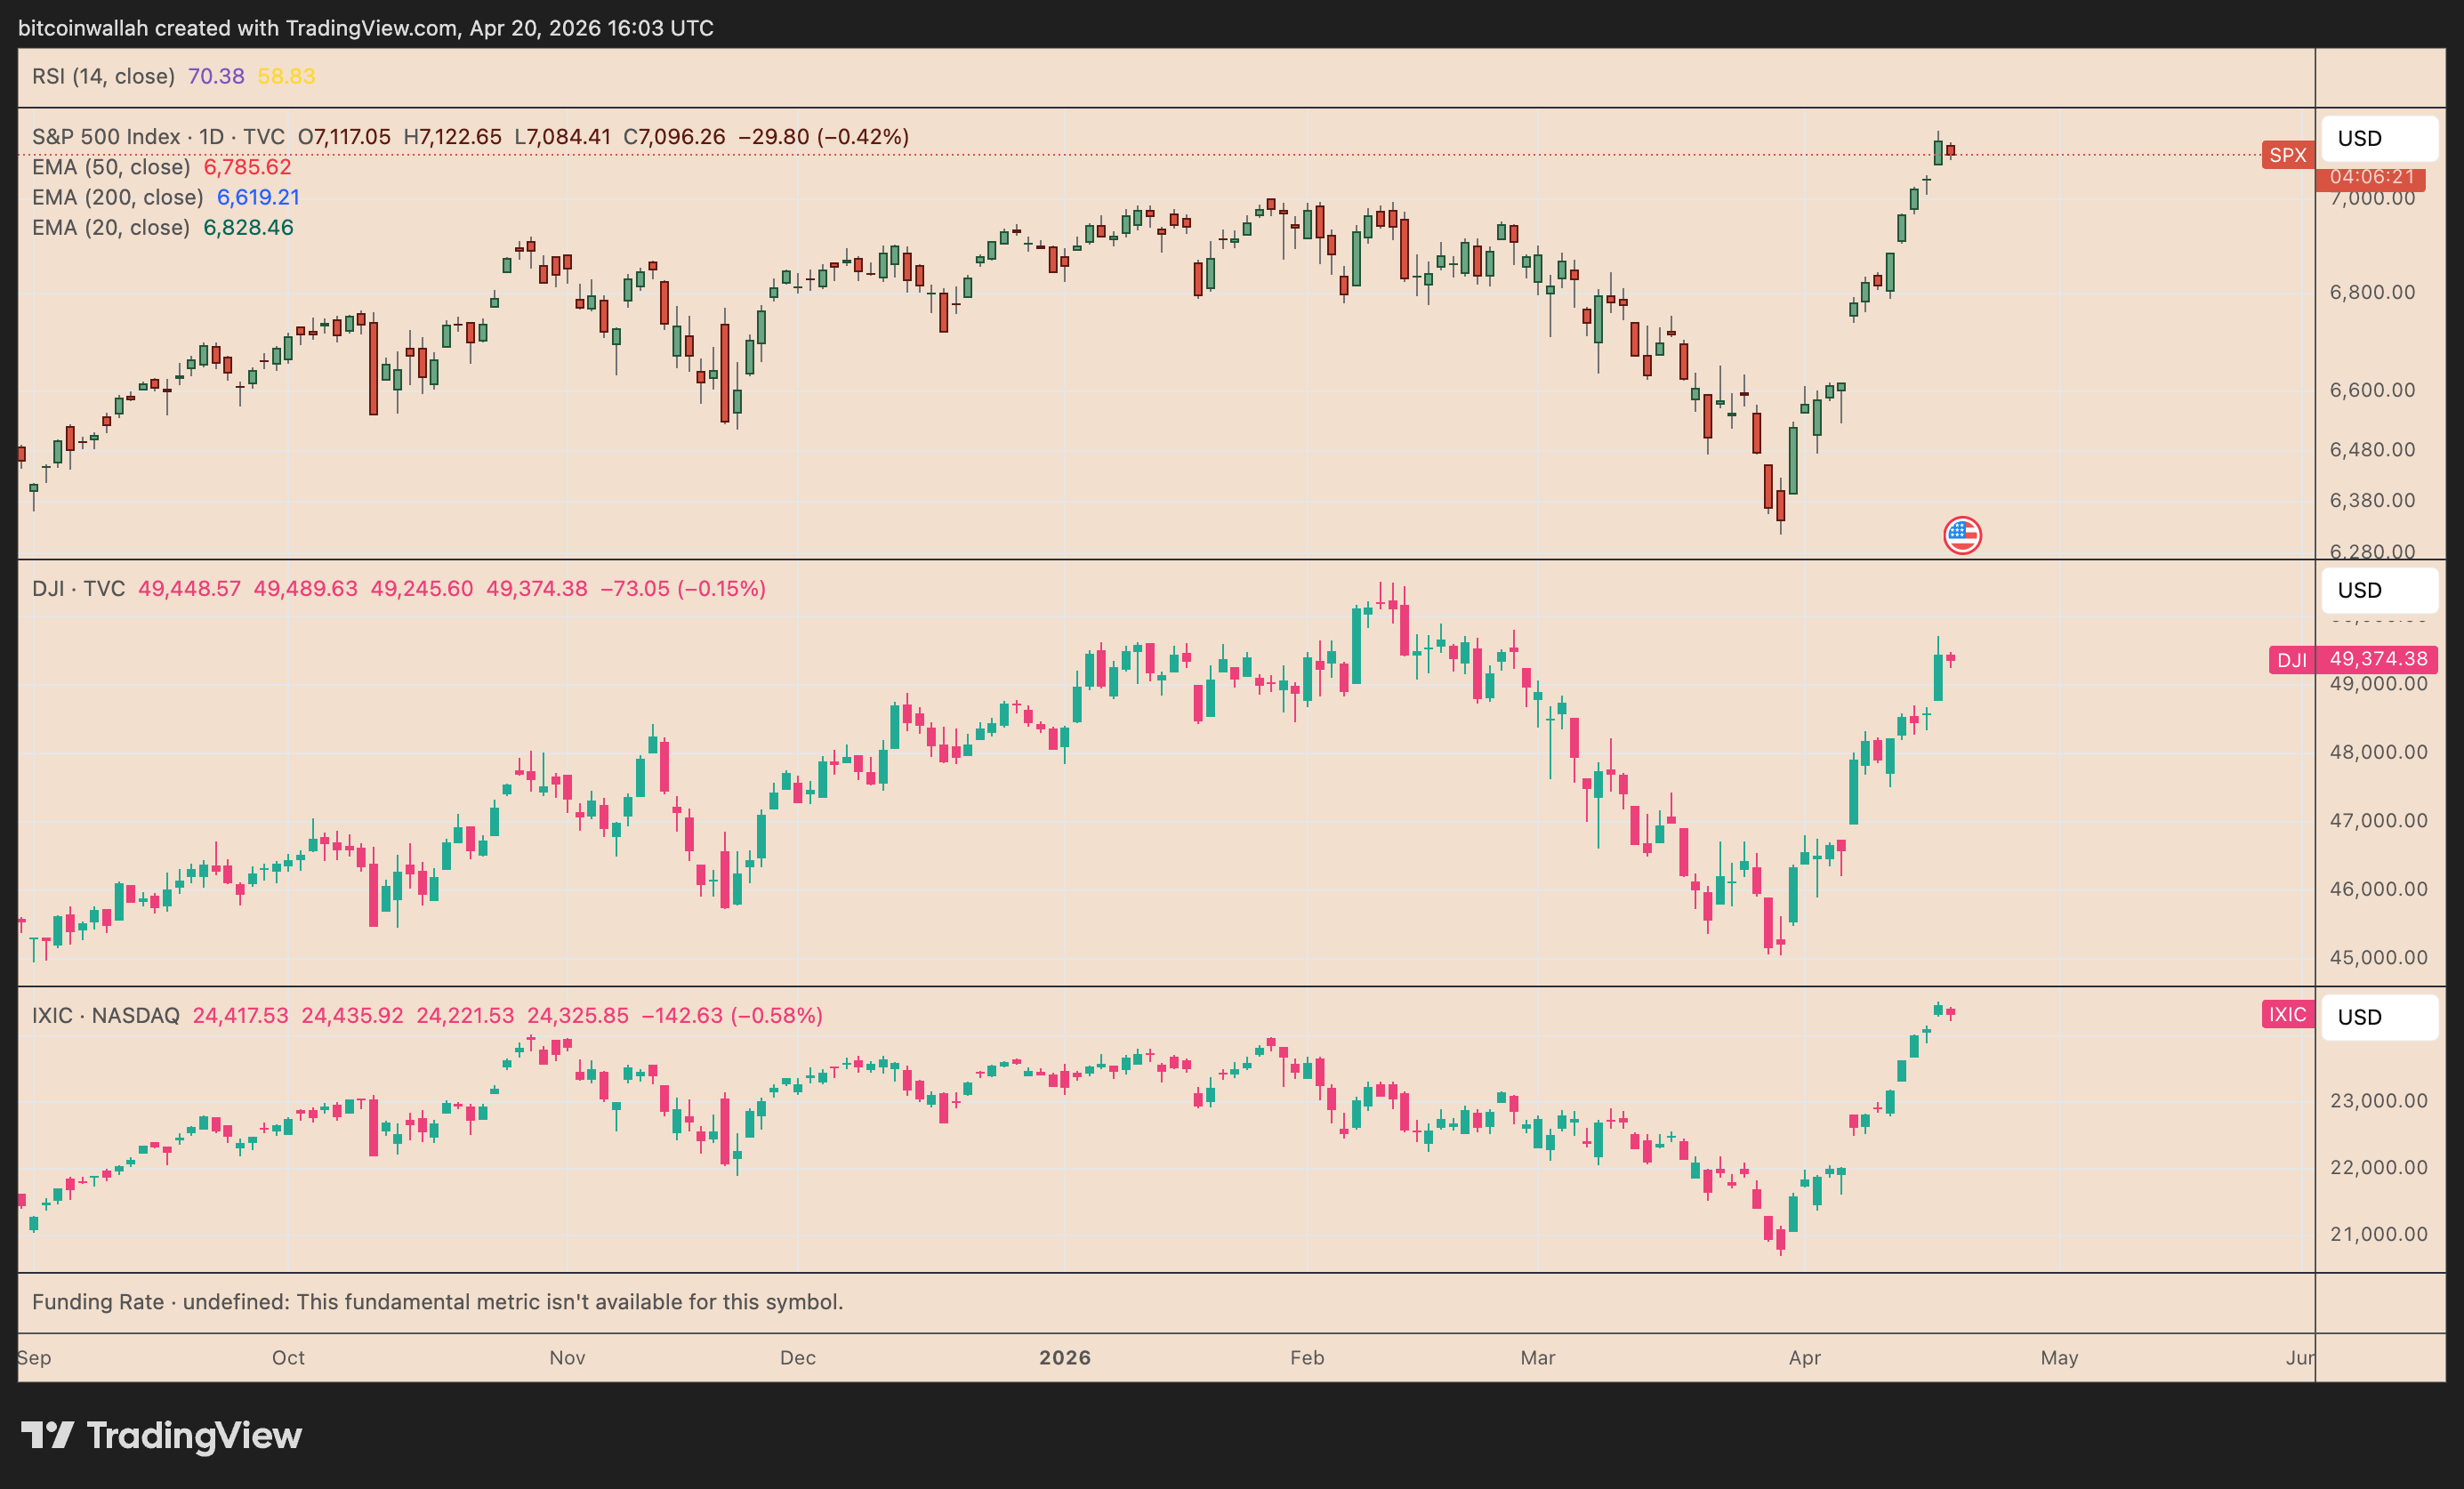
Nasdaq, S&P 500, and Dow Jones daily performance charts. Source: TradingView
US President Donald Trump said it was “highly unlikely” he would extend the two-week truce if no agreement is reached before it expires on Wednesday.
Any signs of an extended Middle East conflict may weigh on BTC’s prices.
BTC flag pullback hints at $67,000–$69,000
Bitcoin’s current chart structure shows classic flag consolidation, with price now drifting toward the pattern’s lower boundary. This setup raises the risk of a pullback toward the $67,000–$69,000 region in April, if support gives way.
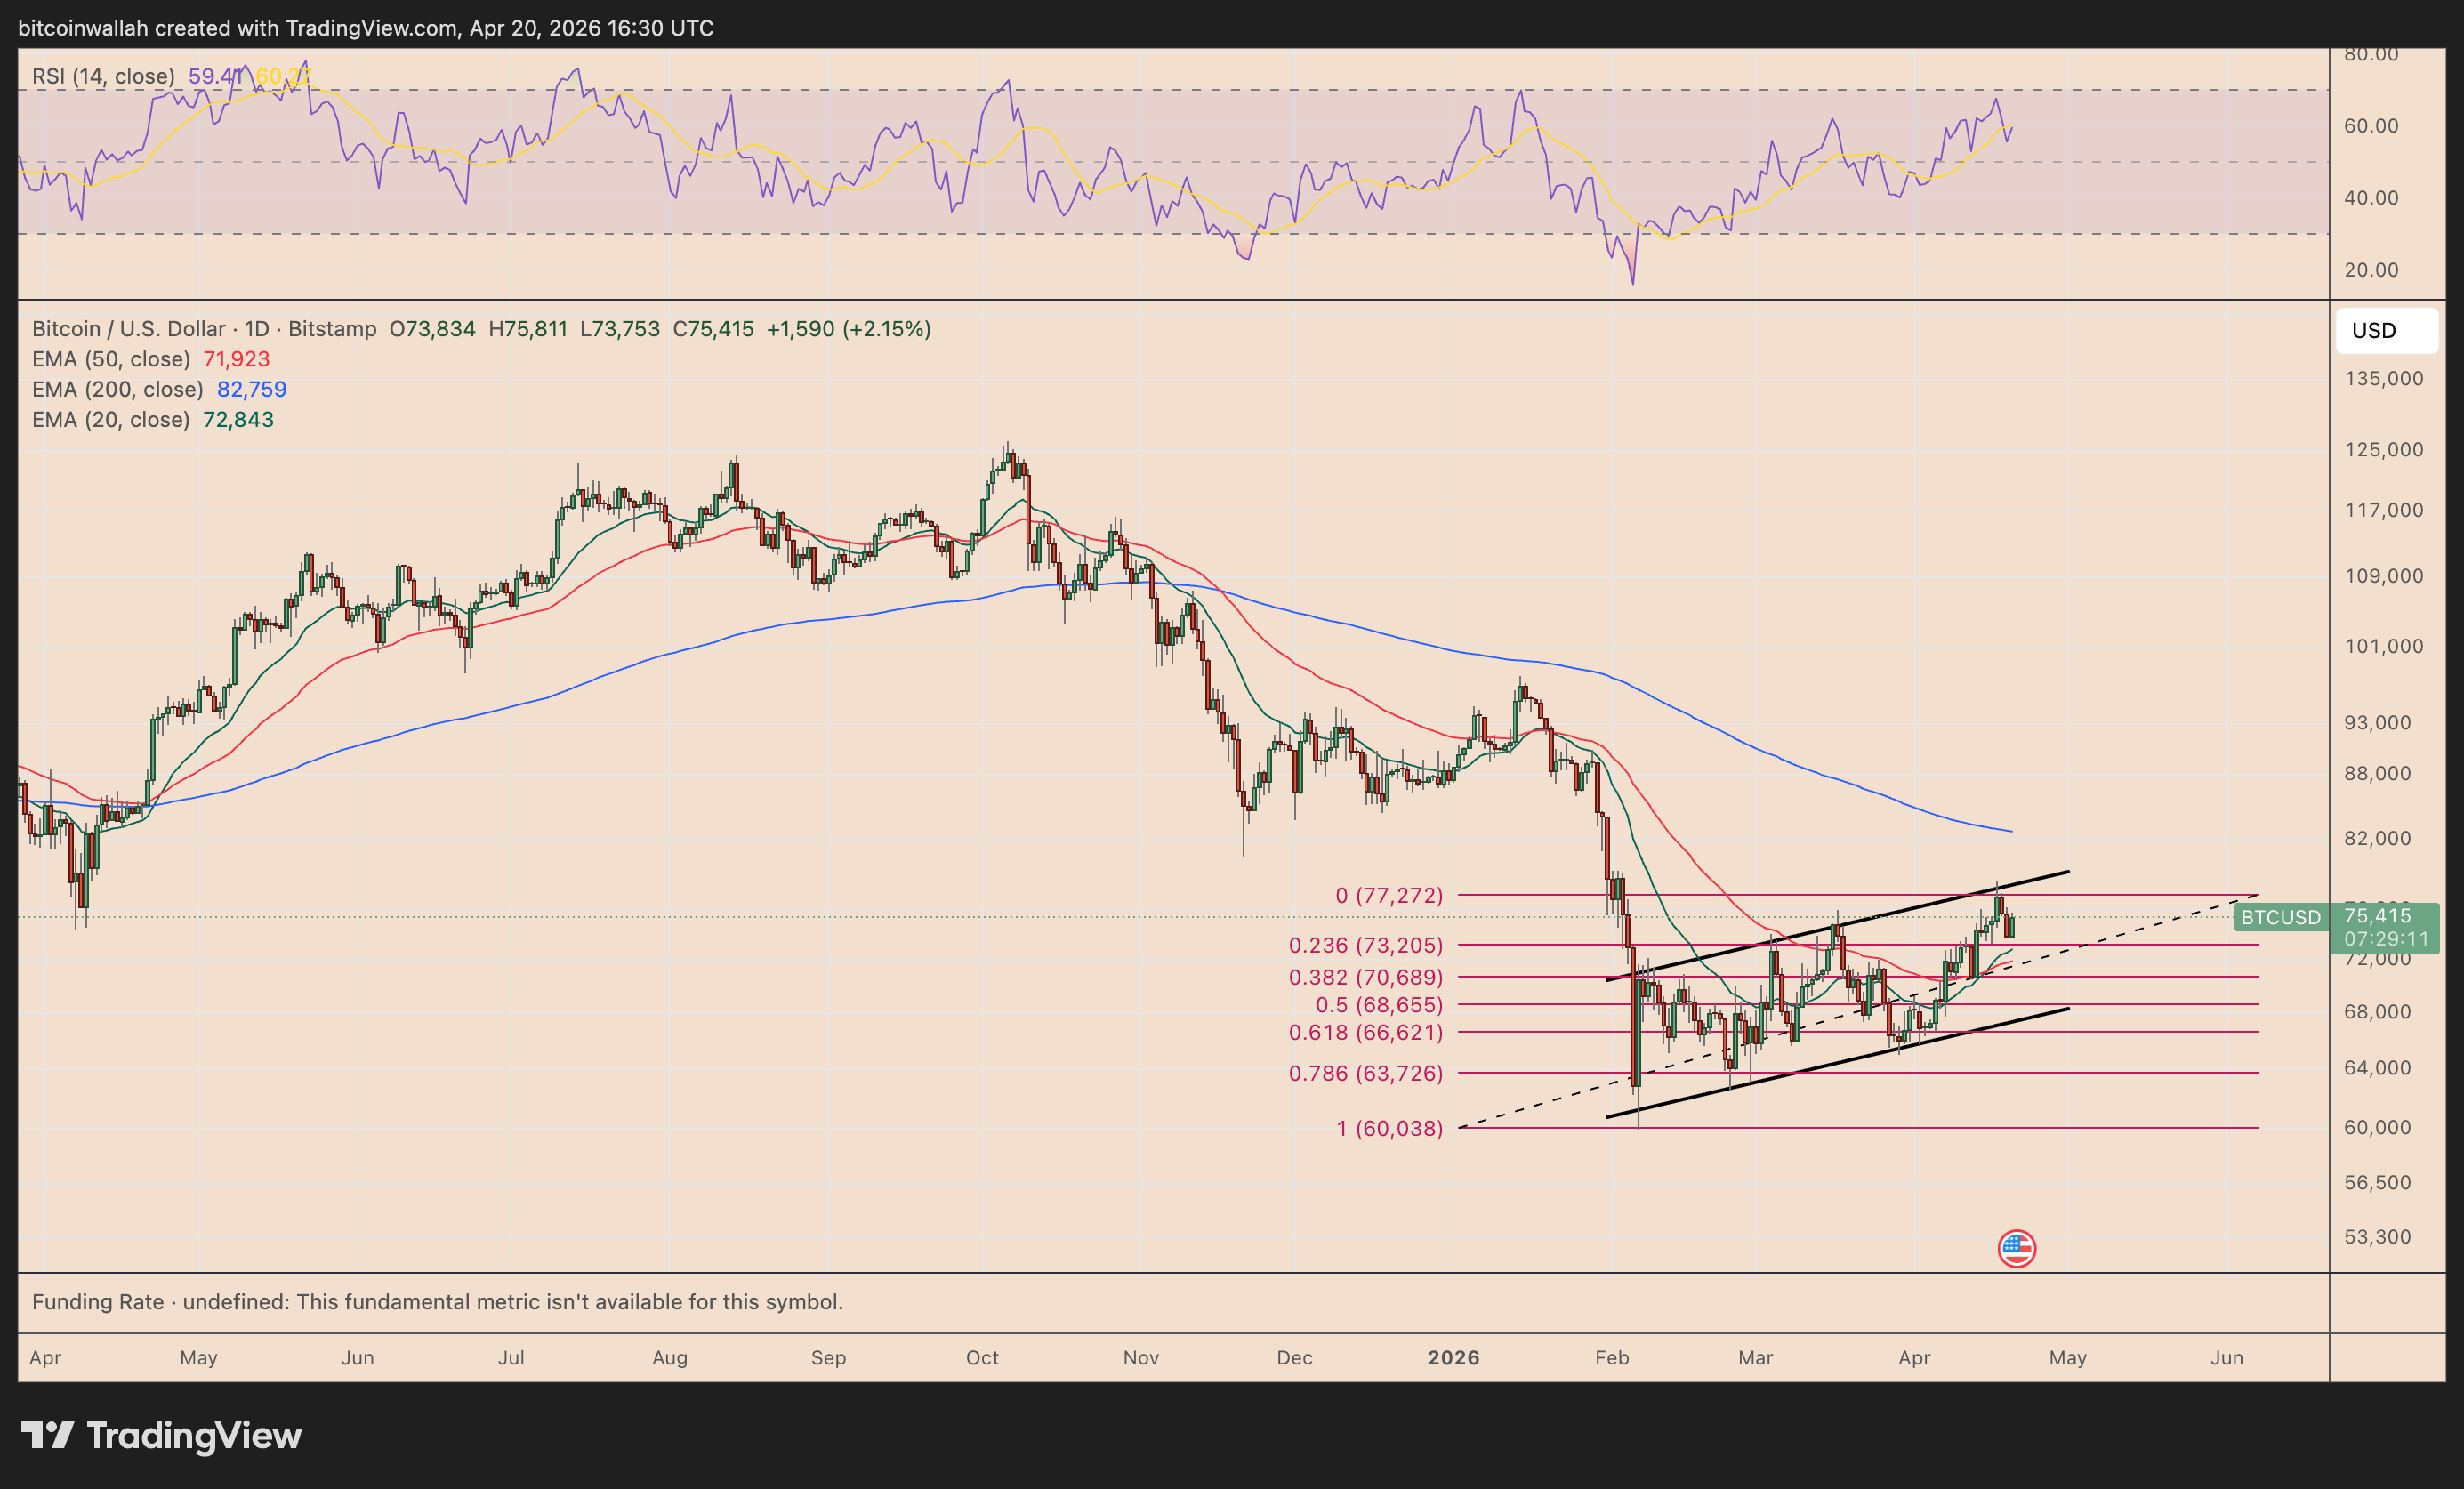
BTC/USD daily chart. Source: TradingView
At the same time, downside may remain limited as the 20-day (green) and 50-day (red) EMAs continue to act as dynamic support levels. Holding above these averages would signal underlying demand, increasing the chances of a rebound.
Related: Adam Back says current demand is ‘almost’ enough to send Bitcoin to $1M
If that happens, BTC could attempt a breakout above the flag’s upper trend line, effectively invalidating the bearish setup.
Such a move would open the door for a recovery toward the 200-day EMA (blue), currently near $82,750.
As Cointelegraph reported, breaking the resistance near $78,000 is now a top priority for the bulls.
Be the first to comment